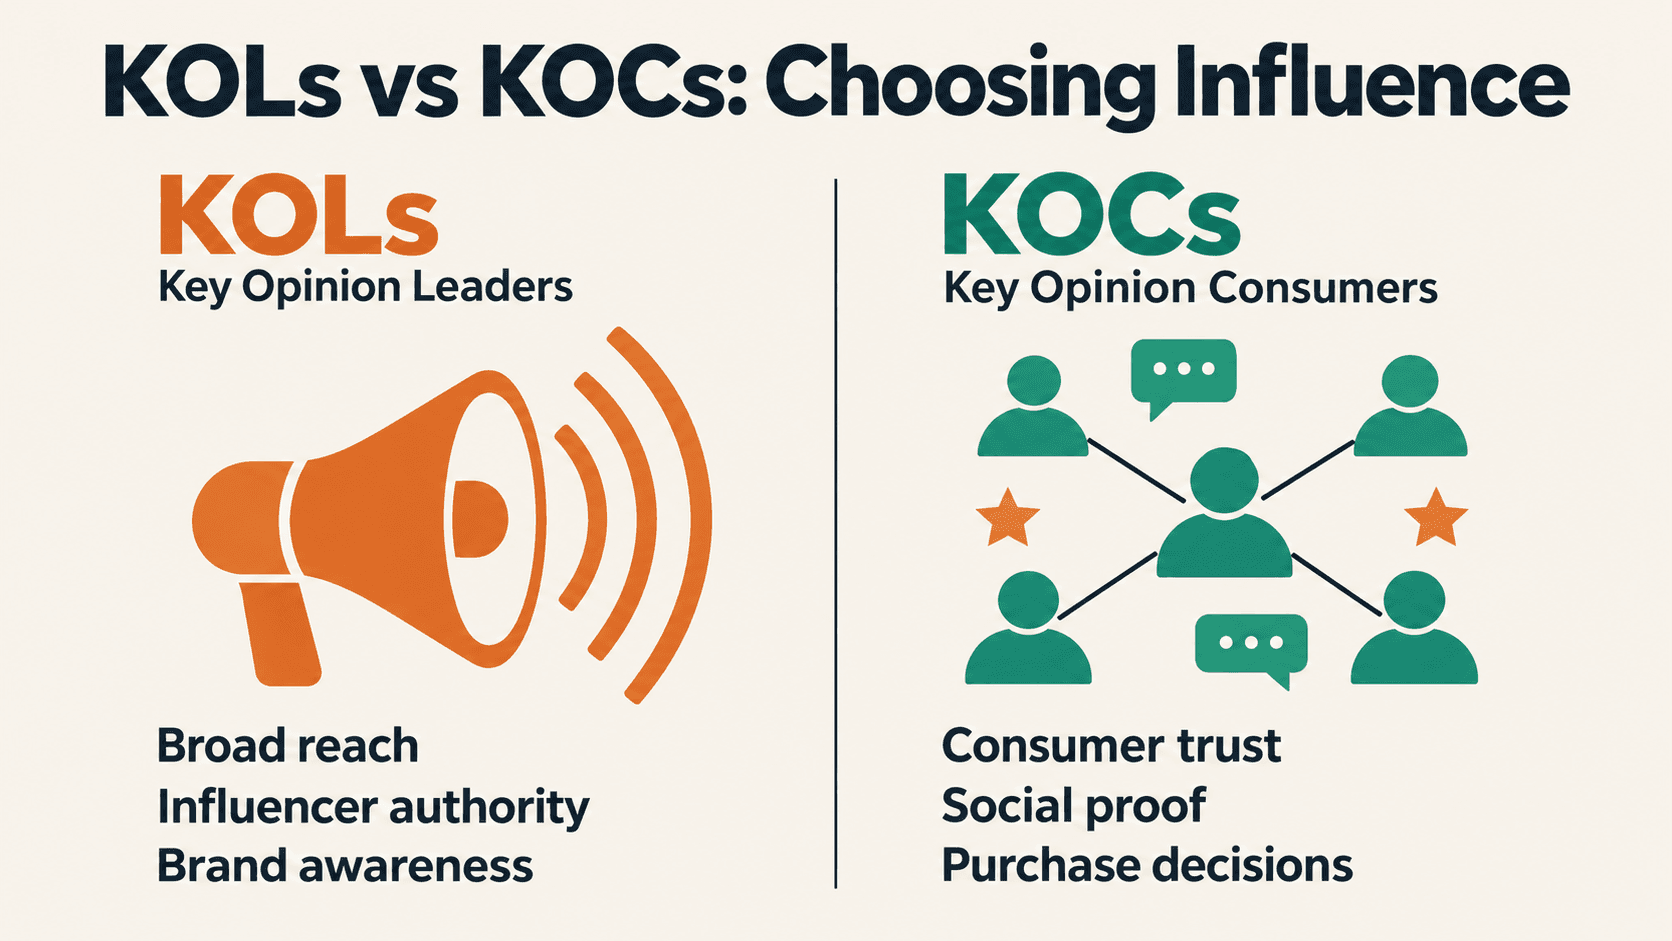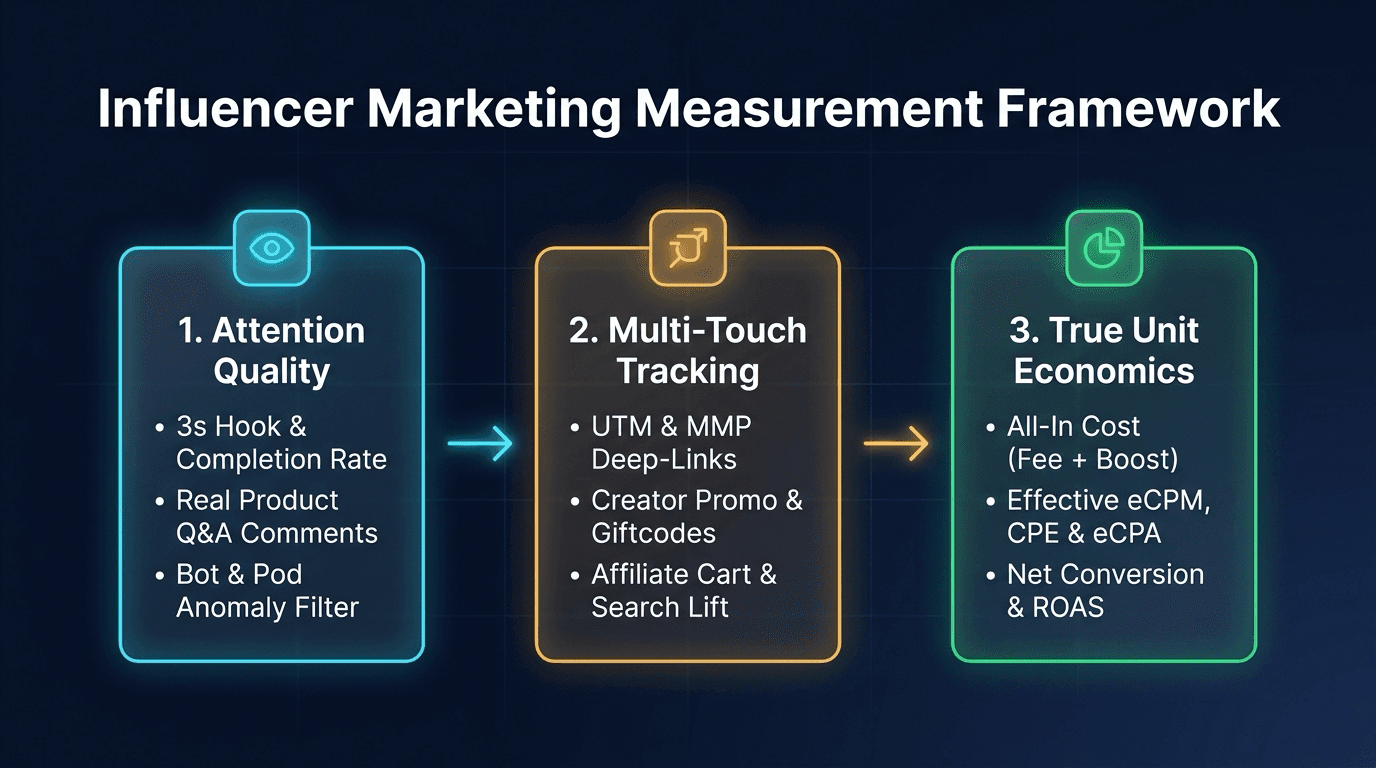
Digital Marketing Budget Allocation Framework by Product Stage and Revenue Target

Digital marketing budget allocation is the structured distribution of capital across brand building (Brand), creator partnerships (Creator), and conversion media (Performance) according to product lifecycle stages. Rather than locking in static quarterly splits, marketing leaders should reverse-calculate spend from net revenue targets using AOV and CAC while reserving a 10%–15% testing pool for bi-weekly reallocation.
Key takeaways
- Rolling over static quarterly budget splits or funneling 100% of capital into short-term performance ads exhausts organic search demand and drives Customer Acquisition Cost (CAC) up once high-intent audiences saturate.
- Under Adsota's operational reference framework, splits across Brand, Creator, and Performance shift across four stages: Soft-Launch (70%–80% Performance testing), Launch Burst (55%–65% Brand and Creator), Scale-Up (50%–60% Performance plus 20%–25% KOC), and Maturity (35%–45% CRM and retargeting).
- Every media plan must be reverse-engineered from net revenue targets through Average Order Value (AOV), post-click funnel conversion rates, and an LTV:CAC guardrail of at least 3:1 before sign-off.
- For creator and social campaigns, pairing a 70/30 production-to-amplification split (Spark Ads / Partnership Ads) with a 10%–15% creative test pool enables disciplined bi-weekly stop-loss and 20% incremental scaling.
Establishing an evidence-based digital marketing budget allocation framework helps Chief Marketing Officers (CMOs) and Chief Financial Officers (CFOs) balance short-term sales targets against long-term brand equity. Many organizations still apply a uniform percentage split across every product line. That static approach causes weak awareness during launches or severe audience saturation during growth phases.
A resilient capital plan never locks fixed channel ratios across an entire fiscal year. Instead, media budgets must anchor on three variables: the product's lifecycle stage, bottom-up reverse math from net revenue targets governed by LTV:CAC, and a 10%–15% experimental pool reviewed every two weeks.
What are the three most common mistakes in quarterly digital marketing budget allocation?
Before building a media spreadsheet, marketing leaders should diagnose three structural errors that frequently derail digital marketing budget allocation within the first month of execution.
1. Rolling over historical channel splits despite shifting user touchpoints
Many teams draft next quarter's budget by taking last quarter's spreadsheet and adding or trimming 10%–15% across every channel. This historical inertia ignores rapid changes in mobile adoption and multi-app user habits.
According to Adsota's Vietnam Digital Advertising Market Report 2019 (published February 2020, citing eMarketer and Statista), online ad spend in Vietnam reached approximately USD 284 million out of USD 1.26 billion in total media spend. Mobile advertising's share of digital budgets jumped from 55.2% in 2018 to 67.1% in 2019. Industry spend also varied sharply across Retail and E-commerce (23.9%), Fast-Moving Consumer Goods — FMCG (12.9%), Automotive (6.7%), and Financial Services (6.2%).
Meanwhile, Adsota's E-Magazine 05: Holiday Marketing in Vietnam 2021–2022 (November 2021, citing Decision Lab Q2 2021 and DataReportal February 2021) recorded 72 million social media accounts in Vietnam (73.7% of the population) with users averaging 7 hours online daily. Simultaneous use of four or more social apps reached 72% among Gen Z, 65% among Millennials (up 10%), and 48% among Gen X (up 13%). Copying prior-year channel splits traps capital in legacy placements where target cohorts no longer engage.
2. Funneling 100% of capital into short-term performance ads until organic demand dries up
Under pressure to deliver immediate return on ad spend (ROAS), leadership teams often cut Brand and Creator budgets to funnel 100% of funds into last-click conversion ads (Performance). During the first four to six weeks, blended ROAS often looks healthy because paid ads are harvesting buyers already in the market.
However, Q&Me (2019) survey data cited in Adsota's February 2020 report shows that only 11% of Vietnamese social media users follow brands and 9% follow celebrities, yet 51% have purchased after seeing social ads. Furthermore, 7SAT's (2020) study cited in Adsota's E-Magazine 05 (November 2021) found that 90% of Vietnamese buyers trust influencer reviews compared with only 33% who trust direct brand ads.
When upper-funnel Brand and Creator investments stop, branded search volume decays and performance campaigns bid against each other for a shrinking buyer pool. This dynamic is visible in Gamota's Vietnam Mobile Game Market Report 2024 (February 2025): in 2024, Vietnamese publishers launched 127 new mobile games (+25 titles YoY) and generated over 40 million downloads (+12% YoY), yet new-release revenue fell 22% to USD 70 million+. Because 70.1% of launches crowded into two saturated sub-genres—Team Battle (35.4%) and MMORPG (34.6%)—bidding solely on direct User Acquisition (UA) without upper-funnel differentiation drove Cost Per Install (CPI) up sharply.
3. Spending 100% of creator budgets on booking fees with zero paid amplification reserve
The third common error is isolating influencer talent budgets from paid media buying. Teams frequently spend 100% of their creator budget on contracted posting fees and rely entirely on organic reach.
According to Appota and OTA Network's The State of Gaming Creators in Vietnam report (March 2022), 89% of creators sit in the Micro (48%, 10,000–100,000 followers) and Medium (41%, 100,000–1 million followers) tiers. During COVID-19 lockdowns, although 80.2% of viewers watched more creator content, only 43.8% of channels gained interaction while 40.7% saw declining interaction. Without reserving 30% of creator funds for paid whitelisting amplification (TikTok Spark Ads or Meta Partnership Ads), top videos lose momentum within 48 hours.
| Common Mistake | Spreadsheet Symptom | Impact After 1–2 Quarters | Structural Correction |
|---|---|---|---|
| 1. Historical Inertia | Copying prior splits with uniform 10%–15% tweaks. | Misses multi-app shifts; wastes impressions. | Re-anchor weights to lifecycle stage and audience habits. |
| 2. 100% Performance Trap | Cutting Brand and Creator for last-click ads only. | High-intent pool saturates; rising frequency inflates CAC. |
Maintain Brand and Creator share to feed branded search. |
| 3. Unamplified Bookings | Spending 100% of creator funds on fees, 0% on boosting. | Reach depends on algorithm luck; top clips miss new buyers. | Enforce a 70/30 split (70% production, 30% amplification). |
A 4-stage digital marketing budget allocation matrix across the product lifecycle
Rather than applying a rigid 60/40 or 70/30 split year-round, an effective digital marketing budget allocation framework shifts capital across four lifecycle stages: Soft-Launch (Validation), Launch Burst, Scale-Up Growth, and Maturity (Retention).
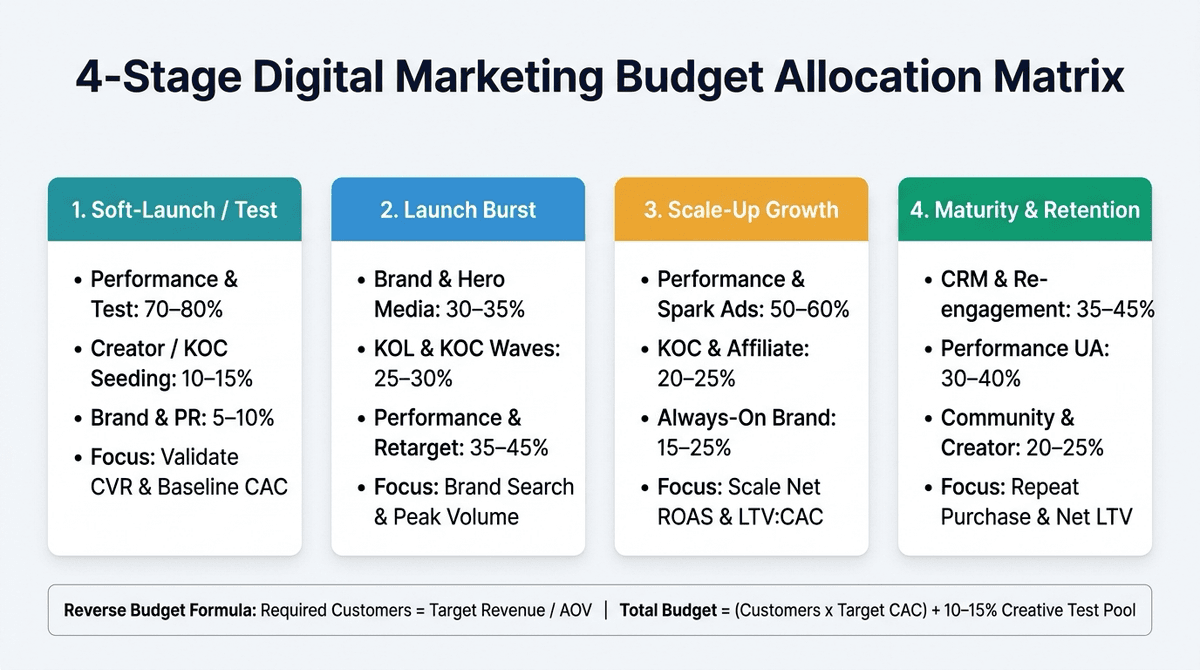
As the matrix diagram above shows, capital priorities shift from validating conversion mechanics during soft-launch, to synchronizing awareness and creator trust at launch, before scaling acquisition and customer lifetime value at maturity.
Reference budget allocation splits across 4 lifecycle stages from Adsota
Drawing on integrated media, creator, and performance operations managed by Adsota for consumer brands, fintech apps, and mobile games in Vietnam, the table below outlines an operational reference framework across four stages (used as a planning baseline rather than a rigid universal rule):
| Stage | Brand & PR | Creator (KOL / KOC) | Performance & CRM | Test Pool | Primary Stage-Gate KPIs |
|---|---|---|---|---|---|
| 1. Soft-Launch | 5% – 10% | 10% – 15% (KOC testing) | 70% – 80% (Funnel A/B tests) | 15% | Landing CVR, baseline CAC, D1/D7 Retention, load < 3s. |
| 2. Launch Burst | 30% – 35% | 25% – 30% (KOL + KOC waves) | 35% – 45% (Search, Retarget) | 10% | Unique Reach, Brand Search Lift, initial order velocity. |
| 3. Scale-Up | 15% – 25% | 20% – 25% (KOC, Affiliate) | 50% – 60% (Paid UA, Spark Ads) | 10% – 15% | Net ROAS, LTV:CAC >= 3:1, verified net eCPA. |
| 4. Maturity | 15% – 20% | 20% – 25% (Community) | 55% – 65% (35%–45% CRM) | 10% | Repeat purchase rate, Net LTV, cohort Payback. |
Operational principles across lifecycle transitions and the 10%–15% test pool
When translating this matrix into a quarterly plan, budget owners should enforce four rules:
- In Soft-Launch, buy data rather than volume: Allocate 70%–80% of spend to controlled performance tests measuring
CTR,CVR, and baselineCAC. Avoid celebrity endorsements while checkout flows orD7 Retentionremain unverified. - In Launch Burst, synchronize Brand and Creator to ignite search demand: Combined Brand (30%–35%) and Creator (25%–30%) budgets represent over half of total spend to create simultaneous visibility. Coordinating the top 11% Macro/Celebrity KOLs with the 89% Micro/Medium creator base should follow our Vietnam creator ecosystem map.
- In Scale-Up, run Performance and KOCs as a twin engine: Expand Performance to 50%–60% alongside 20%–25% KOC and affiliate activation, using paid media to amplify proven creator videos.
- Ring-fence a 10%–15% Experimental Pool every quarter: Reserve 10%–15% of spend to test emerging formats (such as AR livestream overlays) and secondary channels before core ad sets saturate. (Note: Appota's Marketing specialist will confirm additional operational details prior to publication.)
How do you reverse-calculate budget from revenue targets using CAC, AOV, and funnel conversion rates?
Proposing a top-down budget without unit economics often causes misaligned KPIs. Marketing and finance teams should run a bottom-up reverse calculation before approving quarterly spend.
Factoring mobile click friction and post-click drop-off into budget math
Dividing target revenue by product price and multiplying by theoretical CPC underfunds the real budget required. Empirical benchmarks from Adsota's February 2020 report (citing Q&Me 2019, Google & Kantar 2018, and Mobvista 2018) highlight three mobile deductions:
- Non-intent mobile click leakage: On mobile screens, 28% of ad clicks occur because users are forced to click to unlock content, and 24% stem from accidental taps (Q&Me, 2019). Real purchase intent comes from users clicking for product need (45%), visuals (40%), or promotions (27%).
- Mobile page latency drop-off: Research by Google and Kantar (2018) shows 53% of mobile users abandon a site taking over 3 seconds to load, and each extra second of delay cuts conversions by 20%.
- CVR variance across formats: Mobvista (2018) benchmarks show
Non-rewarded native feed(65% of impressions) averages 1.78%CTRand 1.91%CVR;Rewarded video(7% share) hits 4.53%CTRand 2.06%CVR;Native in-feed video(5% share) reaches 3.58%CTRand 0.60%CVR;Interstitial(1% share) logs 7.34%CTRand 1.06%CVR; whileNative app walls(22% share) record 0.84%CTRand 9.18%CVR.
Five-step formula to reverse-engineer budget from net revenue targets
Planning teams calculate required capital across three core equations:
$$N_{\text{net}} = \frac{R_{\text{target}}}{\text{AOV}} \quad ; \quad N_{\text{gross}} = \frac{N_{\text{net}}}{1 - r_{\text{return}}} \quad ; \quad B_{\text{perf}} = N_{\text{new}} \times \text{CAC}{\text{target}} = \frac{N{\text{new}}}{\text{CVR}{\text{real}}} \times \text{CPC}{\text{eff}}$$
The five steps work as follows:
- Step 1 — Isolate new-customer revenue: Subtract projected repeat revenue from existing cohorts (via CRM and LiveOps) from total net revenue (
R_target). - Step 2 — Calculate net (
N_net) and gross orders (N_gross): Divide new-customer revenue byAOV(or 90-dayARPU), then divide by(1 - return rate). - Step 3 — Set maximum CAC via LTV:CAC: Keep
Net LTV : CACat3:1or higher (CAC <= 33% of Net LTV), with payback inside 30–90 days. - Step 4 — Calculate conversion spend (
B_perf): DivideN_grossby verified post-clickCVR(net of accidental clicks and >3s bounces), then multiply by targetCAC. - Step 5 — Add Brand, Creator, and test reserves: Apply the lifecycle weights from Section 2 to scale from
B_perfto total budget.
| Reverse Calculation Item (Illustrative) | D2C Retail / E-Commerce (Scale-Up) | Mobile App / Game (Launch) |
|---|---|---|
1. Quarterly Net Revenue (R_target) |
VND 12,000,000,000 (25% repeat CRM) | VND 6,000,000,000 (100% new users) |
| 2. New-Customer Net Revenue | VND 9,000,000,000 | VND 6,000,000,000 |
3. AOV / 90-Day ARPU |
AOV = VND 600,000 / order |
ARPU_90d = VND 60,000 / install |
4. Net Orders (N_net) / Installs |
15,000 net orders | 100,000 net installs |
| 5. Return / Loss Buffer (10%) | 16,667 gross orders | 110,000 gross installs |
6. Target CAC / CPI (LTV:CAC >= 3:1) |
CAC = VND 120,000 / order |
CPI = VND 20,000 / install |
7. Conversion Spend (B_perf + KOC) |
VND 2,000,000,000 (~75% share) | VND 2,200,000,000 (~55% share) |
| 8. Brand, KOL & Test Pool | VND 667,000,000 (~25% share) | VND 1,800,000,000 (~45% share) |
| 9. Total Budget Required | VND 2,667,000,000 (ROAS 4.5x) |
VND 4,000,000,000 (90-day payback) |
If leadership requests VND 9 billion in new revenue but caps spend at VND 800 million (assuming a VND 48,000 CAC when category CAC is VND 120,000), this table immediately surfaces the gap so teams can align before launch.
Balancing creative production and creator booking fees against paid media spend
A digital marketing budget allocation plan that funds media buying while starving creative production will quickly hit creative fatigue. On algorithmic platforms, creative variety is the primary targeting lever.
The 85/15 creative production rule and 70/30 creator split
According to We Are Social (2019) cited in Adsota's February 2020 report, Facebook video posts in Vietnam achieved a 6.55% average engagement rate, ahead of photos (5.22%), the overall average (3.81%), links (3.25%), and text posts (2.71%). Adsota's June 2021 data cited in E-Magazine 05 (November 2021) also showed 97.6% of Internet users watch online video per session. Yet once weekly ad frequency exceeds 2.5 to 3.0 views per user, CTR drops and CPA climbs.
Appota and OTA Network's March 2022 survey shows 40.6% of creators earn sponsorship revenue, with reference livestream rates spanning USD 250+ (Micro), USD 320–420+ (Medium), USD 850+ (Macro), and USD 2,000+ (Celebrity), plus USD 180+ to USD 2,000+ for VOD videos. Adsota and OTA Network enforce two ratios:
- The 85/15 (or 80/20) Media-to-Production Ratio: Dedicate 80%–85% of funds to paid media and lock 15%–20% for ongoing vertical 9:16 video production and 3-second hook variants. Per GDC's (2024, N = 3,000) survey cited in Gamota's February 2025 report, 49% of game workplaces use Generative AI (GenAI)—led by Business & Finance (44%) and Community, Marketing & PR (41%)—helping teams speed up script variants and storyboards.
- The 70/30 Talent-to-Amplification Ratio: Cap creator booking fees, seeding, and production at 70%, and reserve 30% for paid amplification (Spark Ads or Partnership Ads). After 48 hours of organic delivery, media buyers boost the top 10%–15% of clips with the best 3-second retention and lowest
CPV, following our framework for measuring influencer marketing effectiveness via eCPM, CPE, and eCPA.
Budgeting for statutory compliance under Vietnam's amended Law on Advertising No. 75/2025/QH15
Starting in 2026, creator production budgets must include physical product seeding and legal document checks.
Under Article 15a of the Law Amending and Supplementing a Number of Articles of the Law on Advertising No. 75/2025/QH15 (passed June 16, 2025, effective January 1, 2026), together with Decree 342/2025/ND-CP (effective February 15, 2026) and Decree 87/2026/ND-CP (effective May 15, 2026), influencers conveying advertising products must:
- Verify documents and use products prior to endorsement (Clause 3a, Article 15a): Influencers must verify advertiser credibility and product documentation; if they have not used or do not clearly understand the product, they are prohibited from endorsing it.
- Disclose advertising in real time (Clause 3b, Article 15a): Influencers must clearly disclose advertising immediately before and during delivery.
Brands cannot send scripts to hundreds of KOCs without shipping real samples or test accounts. Sample fulfillment and disclosure audits must be budgeted inside the 70% production line item. (Editorial note: Legal counsel must verify statutory citations against primary Gazette texts prior to publication.)
A bi-weekly budget review and reallocation mechanism (and when NOT to shift spend)
Tweaking budgets daily resets algorithmic learning phases, whereas waiting until quarter-end lets losing channels burn capital. At Adsota, a 14-day bi-weekly cycle provides enough conversion volume for algorithmic stability while matching e-commerce settlement windows (7–14 days for delivery and returns):
| Bi-Weekly Signal | Quantitative Trigger | Reallocation Action | Algorithmic Guardrail |
|---|---|---|---|
| 1. Stop-Loss | Net CAC exceeds target by >30% after spending 3 × CAC (or 7 days). |
Pause bleeding ad sets; shift funds to cohorts meeting LTV:CAC. |
Check whether low CTR (creative) or low CVR (page) caused the miss. |
| 2. Scale (+20%) | Logs >= 30–50 conversions/week with CAC >= 15% below target for 5–7 days. |
Raise budget by at most +20% every 48–72 hours from reserves. | Never double (+100%) budgets overnight, which resets learning phases. |
| 3. Creative Refresh | Weekly Frequency exceeds 2.8–3.0x while CTR drops >20%. |
Use the 15%–20% production pool to launch 3–5 new hooks or Spark Ads. | Launch new creatives alongside winners before pausing fatigued ads. |
| 4. Test Graduation | End of each 14-day sprint for experiments in the 10%–15% pool. | Move tests with CAC <= Target into Core Performance; close losers. |
Judge tests on incremental conversions, not raw video views. |
Four scenarios where brands should NOT scale budgets or overhaul channel splits
Budget owners should freeze spend increases in four situations:
- Mobile pages take over 3 seconds to load or payment gateways fail: Because 53% of mobile users abandon pages taking over 3 seconds to load (Google & Kantar, 2018), adding budget during technical bottlenecks only amplifies wasted clicks.
- Ad sets remain inside the learning phase (<72 hours or <30 conversions): For high-ticket retail, B2B software, or fintech apps requiring
eKYC, cutting spend after 24–48 hours prevents algorithms from finding qualified buyers. - Order return rates or day-1 app churn spike: If gross orders or installs look cheap but COD returns exceed 20%–30%—or game
D1 Retentiondrops—halt scaling to fix onboarding first. - Platform conversions are not deduplicated against CRM or MMP records: Never shift budgets based on raw sums of self-attributed conversions from Meta, Google, and TikTok without reconciling against net settled orders in your CRM or MMP.
Before approving next quarter's plan, map each product to its lifecycle stage, reverse-calculate required spend from net revenue via AOV and CAC, lock in your 15%–20% creative production and 30% creator amplification reserves, and run bi-weekly reallocation reviews. Explore more guides in the Marketing and Creator topic hub on Appota Insights.
If your organization needs an experienced partner to structure integrated Brand, Creator, and Performance budgets, build lifecycle KPI matrices, and execute conversion-driven campaigns in Vietnam, connect with Adsota's digital marketing strategy team for a consultation.
Sources
- Báo cáo thị trường quảng cáo số Việt Nam 2019 (Vietnam Digital Advertising Report 2019), Adsota (Appota Group), 2020-02-20, accessed 2026-11-03
- Báo cáo thị trường game mobile Việt Nam 2024 (Vietnam Mobile Game Market Report 2024), Gamota R&D (Appota Group), 2025-02-15, accessed 2026-11-03
- E-Magazine 05: Tái kết nối với khách hàng mùa lễ hội 2021–2022, Adsota (Appota Group), 2021-11-15, accessed 2026-11-03
- E-Magazine: Tổng quan Gaming Creators Việt Nam (The State of Gaming Creators in Vietnam), Appota & OTA Network, 2022-03-15, accessed 2026-11-03
- Luật sửa đổi, bổ sung một số điều của Luật Quảng cáo số 75/2025/QH15 và Nghị định 342/2025/NĐ-CP, Quốc hội & Chính phủ Việt Nam (dẫn qua Thư viện Pháp luật), 2025-06-16, accessed 2026-11-03