
Vietnam Digital Advertising Market Report 2019
Adsota's 2019 report finds the Vietnam digital advertising market reached approximately USD 284 million out of USD 1.26 billion in total media spend, with mobile ads capturing 67.1% of digital budgets. Retail and e-commerce led industry spending at 23.9%, backed by 68 million Internet users spending 6 hours and 42 minutes online daily.
An executive analysis of the USD 284M Vietnam digital advertising market, 67.1% mobile ad share, industry spend breakdown, and 2020 media trends from Adsota.
Key findings
- USD 284MEstimated online advertising expenditure in Vietnam in 2019 out of USD 1.26 billion in total media spending (representing 20.6% in regional benchmarks and projected to reach 24.7% of USD 1.43 billion by 2022, eMarketer).
- 67.1% mobile shareMobile advertising's share of total digital ad budgets in Vietnam in 2019—jumping from 55.20% in 2018 and projected to reach 68.4% by 2022, excluding MMS and P2P messaging (eMarketer).
- 23.9% & 12.9%Share of 2019 digital advertising spend captured by Vietnam's top two vertical spenders: Retail & E-commerce (23.9%) and Fast-Moving Consumer Goods / FMCG (12.9%) (Statista).
- 68M & 65M usersActive Internet users (70% of Vietnam's 97 million population) and active social media users (67% penetration, growing 9.6% with 5.7 million new users in 2019 to rank 6th globally) (We Are Social, 2020).
- 748.64M downloadsCombined App Store and Google Play app downloads in Vietnam through Q2 2019 (21% iOS, 79% Android), ranking 7th worldwide (AppTweak) across 43.7 million active smartphone users (Newzoo).
- 6.55% & 9.18% CVRAverage engagement-to-reach rate for Facebook video posts in Vietnam reached 6.55% (We Are Social), while Native app walls led Southeast Asian mobile ad conversion rates at 9.18% (Mobvista).
- 51% social buyersShare of surveyed Vietnamese users who purchased after seeing social media ads despite only 11% actively following brands (Q&Me, 2019); meanwhile, 53% leave mobile sites taking over 3 seconds to load (Google & Kantar).
How did Internet and mobile adoption shape the Vietnam digital advertising market in 2019?
Entering early 2020, the Vietnam digital advertising market operated across a population of 97 million people (50.1% male, 49.9% female; median age 32.6; 36% urban). According to We Are Social's Digital 2020 dataset cited by Adsota, Vietnam recorded 145.8 million mobile subscriptions and 68.0 million active Internet users, representing 70% national penetration.
Social media reached 65.0 million active users (67% of the population), including 58.0 million accessing social platforms via mobile devices (59.8% of the population). During 2019 alone, Vietnam added 5.7 million new social media users (+9.6% year-on-year), ranking sixth worldwide in net audience expansion. Among Vietnamese adults, 97% used a mobile phone, 72% used a smartphone, 13% used a tablet, and 1% used a smart wearable device.
Retail smartphone shipments versus active device reality
Media planners entering Vietnam frequently misjudge device targeting when relying solely on new retail shipment reports. End-of-2019 retail figures from GfK show Samsung and Oppo leading new unit sales, while budget challenger Realme climbed to a 6.3% retail share on strong price-to-spec value.
Active web and app traffic measured by StatCounter in 2019 tells a different story. Apple's iPhone accounted for 40.4% of active smartphones in Vietnam—driven largely by parallel-import and pre-owned handsets—while Sony and Huawei nearly vanished from active usage charts. Meanwhile, the tablet segment stagnated under an entrenched Apple-and-Samsung duopoly.
Operating-system version lag also creates technical constraints for rich-media creatives and attribution SDKs:
- Android powered 58% of active smartphones. However, only 38.68% of Android devices ran Android 9.0 Pie, while the remainder fragmented across 8.1 Oreo (15.02%), 5.1 Lollipop (9.80%), 6.0 Marshmallow (7.67%), and other older releases (19.51%).
- iOS captured over 40% of smartphones and 73% of tablets. By late 2019, iOS 13 adoption stood at 48.39%, trailed by iOS 12 (24.76%) and legacy versions (26.85%).
Growth teams can track how these handset dynamics evolved over the following six months in our H1 2020 Vietnam mobile and smartphone application market report.
Seventh worldwide in app downloads and platform concentration
Newzoo's Global Mobile Market Report 2019 ranked Vietnam 14th globally in active smartphone users at 43.7 million (44.9% penetration against Newzoo's 97.4 million population baseline), just ahead of the Philippines (36.3 million; 33.6%). Globally, China led active smartphone volume (851.1 million; 59.9%), followed by India (345.9 million; 25.3%) and the United States (260.2 million; 79.1%).
Despite ranking 14th in active handsets, Vietnam punched far above its weight in software consumption. AppTweak's cumulative Q2 2019 store rankings placed Vietnam seventh worldwide with 748,641,400 combined App Store and Google Play downloads (21% iOS, 79% Android)—trailing only India (5.18B), the United States (3.33B), Brazil (1.89B), Indonesia (1.54B), Russia (1.12B), and Mexico (877.8M), while outpacing Turkey, Japan, and the United Kingdom.
Store grossing breakdowns from Applyzer alongside App Annie's 2019 annual charts highlight where Vietnamese mobile attention concentrates:
- Mobile games dominated storefront monetization. Games generated 49.5% of top-grossing share on the Apple App Store (ahead of Photography at 6.3%, Social at 6.3%, Entertainment at 6%, and Healthcare at 5.7%) and 82.2% on Google Play (ahead of Social at 7%, Entertainment at 3.8%, Productivity at 1.9%, and Education at 1.3%).
- Messaging, short video, and marketplaces topped download charts. App Annie's top ten downloaded apps of 2019 were Facebook Messenger, Facebook, TikTok, Zalo, Zing MP3, Shopee, B612, Lazada, WiFi Master Key, and Kwai—led by publishers Facebook, VNG, Google, Toutiao, and Naver. Top downloaded games included Arena of Valor, Free Fire, Helix Jump, My Talking Tom, and PUBG Mobile, led by VNG, BabyBus, Sea, Outfit7, and Voodoo.
- YouTube, Facebook, and Zalo anchored daily reach. According to We Are Social (2019), 96% of Vietnamese Internet users accessed YouTube, 95% used Facebook, 51% used Instagram, 22% used LinkedIn, and 19% used Pinterest. Among messaging apps, Facebook Messenger (79%) and domestic super-app Zalo (74%) dwarfed Skype (33%), Viber (28%), and LINE (23%).
Where did Vietnam's USD 284 million online ad spend go across industries?
According to eMarketer (2019) estimates cited in the report, online advertising expenditure in Vietnam reached approximately USD 284 million in 2019 out of USD 1.26 billion in total media ad spending. Within eMarketer's regional benchmark table, digital accounted for 20.6% of total media budgets in Vietnam—closely aligned with the Philippines (21%), Thailand (22%), and Malaysia (22.5%), ahead of India (17.4%), yet leaving substantial headroom compared with Singapore (27.2%), Japan (29.9%), South Korea (41.3%), Taiwan (44.6%), and China (64.8%).
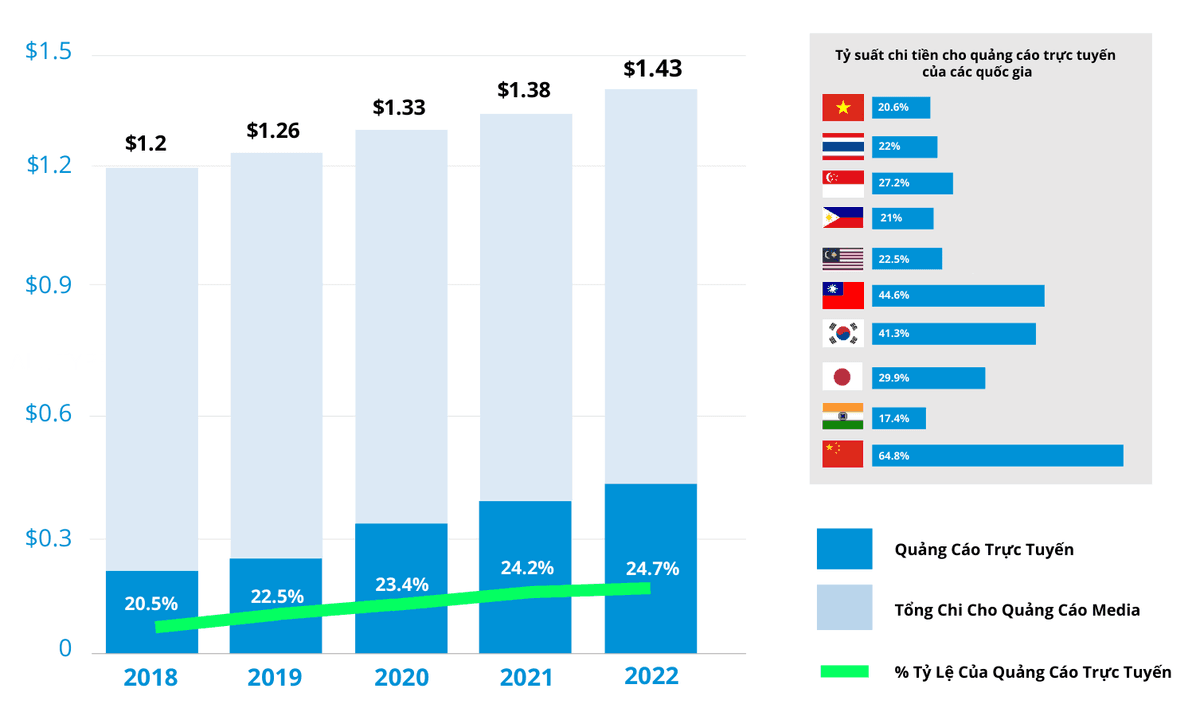
Across eMarketer's five-year forecast horizon (2018–2022), Vietnam's digital allocation expands steadily while shifting overwhelmingly onto mobile screens:
| Forecast Year (eMarketer) | Total Media Ad Spend (USD) | Digital Share on Forecast Bar | Mobile Share of Digital Ad Spend |
|---|---|---|---|
| 2018 | USD 1.20B | 20.5% | 55.20% |
| 2019 | USD 1.26B | 22.5% (regional table: 20.6%) | 67.10% |
| 2020 (forecast) | USD 1.33B | 23.4% | 67.80% |
| 2021 (forecast) | USD 1.38B | 24.2% | 68.10% |
| 2022 (forecast) | USD 1.43B | 24.7% | 68.40% |
Mobile advertising's 11.9-percentage-point surge in a single year—climbing from 55.20% in 2018 to 67.10% in 2019 (excluding MMS and P2P messaging)—confirmed mobile devices as the primary delivery rail for more than two-thirds of digital media budgets in Vietnam.
Industry spend distribution and the four-way e-commerce traffic race
Statista's 2019 vertical breakdown shows digital media budgets concentrating heavily around online retail and consumer packaged goods.
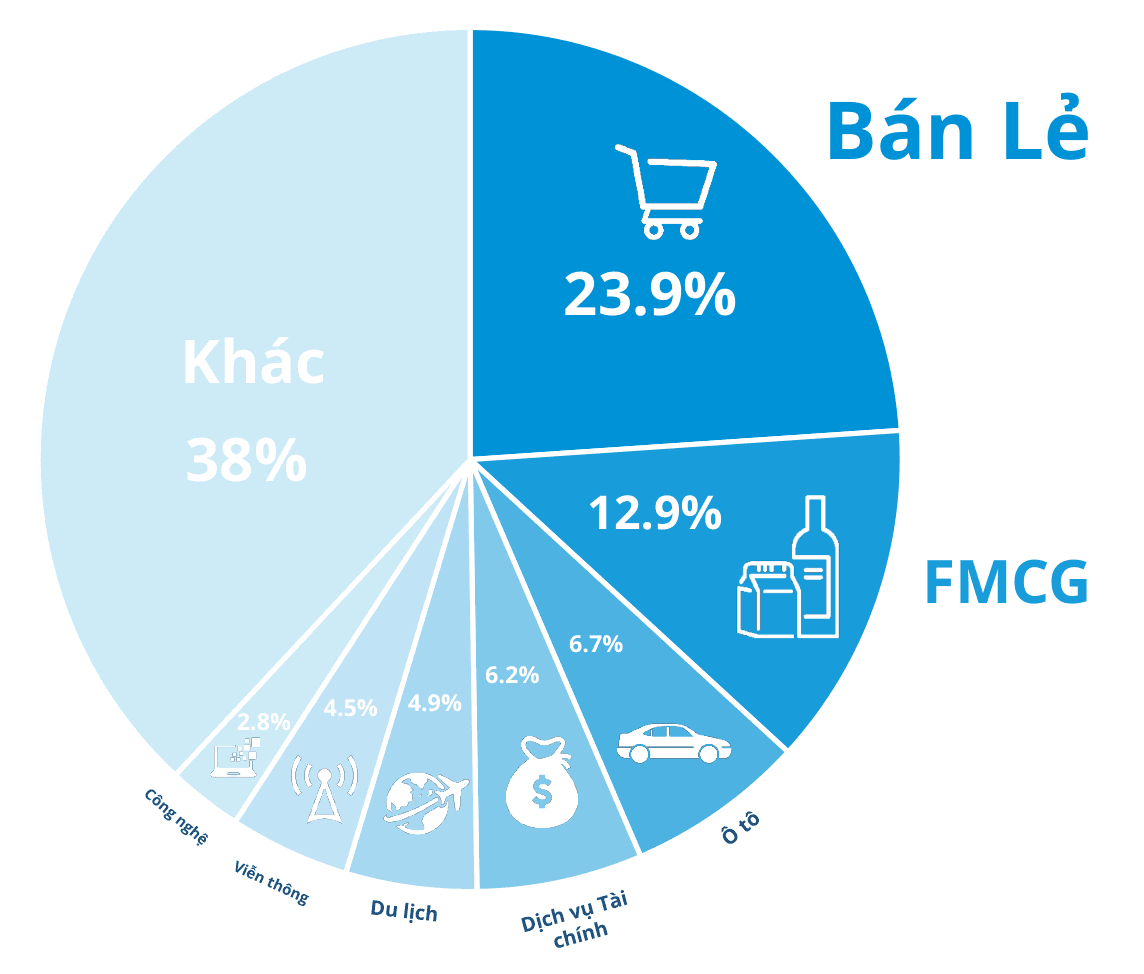
Retail and E-commerce led all sectors at 23.9% of digital ad expenditure—nearly double second-place Fast-Moving Consumer Goods / FMCG (12.9%). Rounding out named verticals were Automobiles (6.7%), Financial Services (6.2%), Tourism (4.9%), Telecommunications (4.5%), and Technologies (2.8%), alongside 38% distributed across remaining categories such as real estate, education, healthcare, and entertainment.
Fierce user-acquisition battles among Vietnam's top four online marketplaces fueled that 23.9% retail spend share. Tracking from iPrice Group in Q3 2019 illustrates a dramatic reordering of marketplace traffic compared with Q3 2017:
| Marketplace (iPrice, Q3 2019) | Monthly Web Visits (Q3 2019) | App User Share | Rank Shift vs. Q3 2017 | Signature 2019 Marketing Playbook |
|---|---|---|---|---|
| Shopee | 34,569,900 | 21.3% | Climbed from #4 (18.95M) to #1 | Blockbuster ambassadors: Cristiano Ronaldo, BlackPink, Hương Giang, Hoài Linh |
| Sendo | 30,929,800 | 6.5% | Climbed from #3 (24.00M) to #2 | Mass-market endorsement with pop icon Mỹ Tâm targeting provincial buyers |
| Tiki | 27,114,500 | 10.2% | Climbed from #5 (18.04M) to #3 | Ambassadors Trường Giang & Nhã Phương plus dozens of V-pop MV sponsorships |
| Lazada | 24,364,700 | 4.6% | Dropped from #1 (50.48M) to #4 | Pivoted from mass ads toward shoppertainment livestreams with KOLs & streamers |
Across all tracked e-commerce websites in 2019, iPrice found domestic Vietnamese marketplaces captured 72% of web traffic versus 28% for foreign-owned platforms. After pulling back mass-media spending and watching monthly web visits fall by more than half from Q3 2017, Lazada pivoted toward interactive livestream concerts featuring creators and streamers (Gil Lê, Miu Lê, PewPew, ViruSs). How these retail players subsequently adapted during pandemic lockdowns is examined in our retail and e-commerce pandemic adaptation report.
How did video platforms, generational social habits, and mobile ad formats perform?
Creative performance benchmarks in 2019 favored motion over static formats. According to We Are Social (2019), Facebook video posts in Vietnam generated an average engagement-to-reach rate of 6.55%—outperforming photo posts (5.22%), the all-post average (3.81%), link posts (3.25%), and text-only status updates (2.71%).
Video engagement dominance across social platforms and local publisher networks
Consumer longitudinal surveys from Q&Me between 2016 and 2019 reinforce that creative shift. Vietnamese users expressing a positive preference for social video rose from 37% in 2016 to 49% in 2019, while video dislike rates dropped from 33% to 19%. Positive sentiment also improved for interactive games (38% to 44%), Q&A posts (34% to 40%), and infographics (21% to 34%), whereas celebrity gossip slipped from 40% to 34%.
On the supply side, Q&Me (2017) data cited by Adsota indicates 85% of businesses in Vietnam already deployed video marketing, distributing across YouTube (91%), Facebook (86%), owned corporate websites (65%), ad networks/DSPs (15%), and domestic browser Cốc Cốc (6%). Yet Comscore's 2019 Video Metrix reveals a massive retention gap between global video platforms and domestic news ad networks:
- YouTube (Google) commanded unmatched viewing depth. YouTube reached 13,676,000 monthly unique viewers in Vietnam, serving 3.50 billion video views at an average of 1,522.20 minutes per viewer.
- Facebook ranked second in social video reach. Facebook attracted 10,012,000 monthly unique video viewers and 193.90 million views, averaging 153.5 minutes per viewer.
- Domestic publisher networks aggregated news video inventory. Admicro – VCCorp reached 2,365,000 unique viewers (51.12M videos; 2.5 minutes/viewer), 24H Advertising Group reached 2,156,000 viewers (42.05M videos; 38 minutes/viewer), and Adtima – VNG reached 2,014,000 viewers (18.63M videos; 6 minutes/viewer).
Across overall monthly website traffic tracked by We Are Social (2019), global giants Google (371.7M visits), Facebook (341.6M), and YouTube (334.1M) were followed by domestic news and utility leaders VnExpress on Eclick (68.3M visits in the English edition / 63.8M in the Vietnamese edition), Zing.vn on Adtima (55.8M), Kenh14 on Admicro (33.2M), Cốc Cốc (28.6M), and 24h.com.vn (28.1M).
Generational platform splits and mobile CTR versus CVR benchmarks
Decision Lab's The Connected Consumer 2019 demonstrates why uniform media mixes miss generational nuances. While Facebook maintained broad parity across age brackets, secondary platforms diverged sharply by cohort.
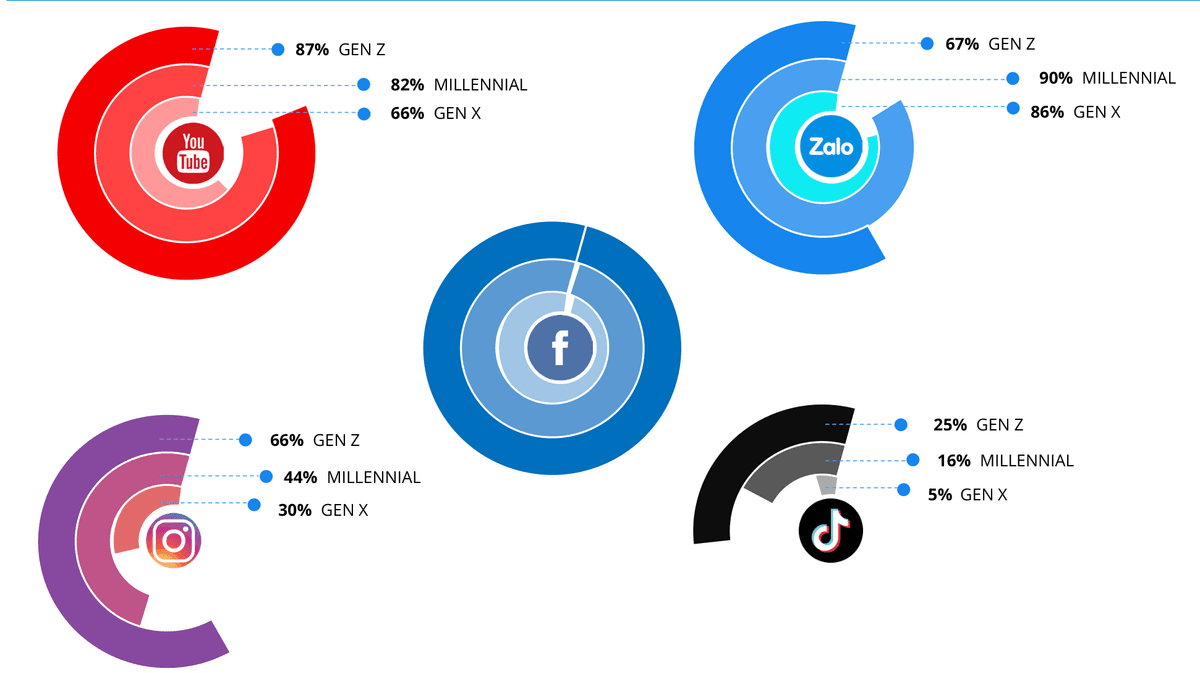
Zalo penetrated 90% of Millennials (born 1981–1996) and 86% of Gen X users (1960–1980), making it indispensable for working-age and family segments, whereas Gen Z adoption stood lower at 67% (1997–2003). Conversely, Gen Z led usage on YouTube (87% vs. 82% Millennial and 66% Gen X), Instagram (66% vs. 44% and 30%), and emerging short-video platform TikTok (25% Gen Z vs. 16% Millennial and just 5% Gen X).
Within programmatic mobile supply, Vpon (2018) data shows in-app inventory accounted for 57% of Vietnam's mobile ad impressions versus 43% on mobile web—more balanced toward mobile web than the 66% in-app Asian average or app-heavy peers Indonesia (78%) and Thailand (70%). When buying in-app placements, Southeast Asian format benchmarks from Mobvista (2018) expose sharp trade-offs between impression scale, click-through rate (CTR), and conversion rate (CVR).
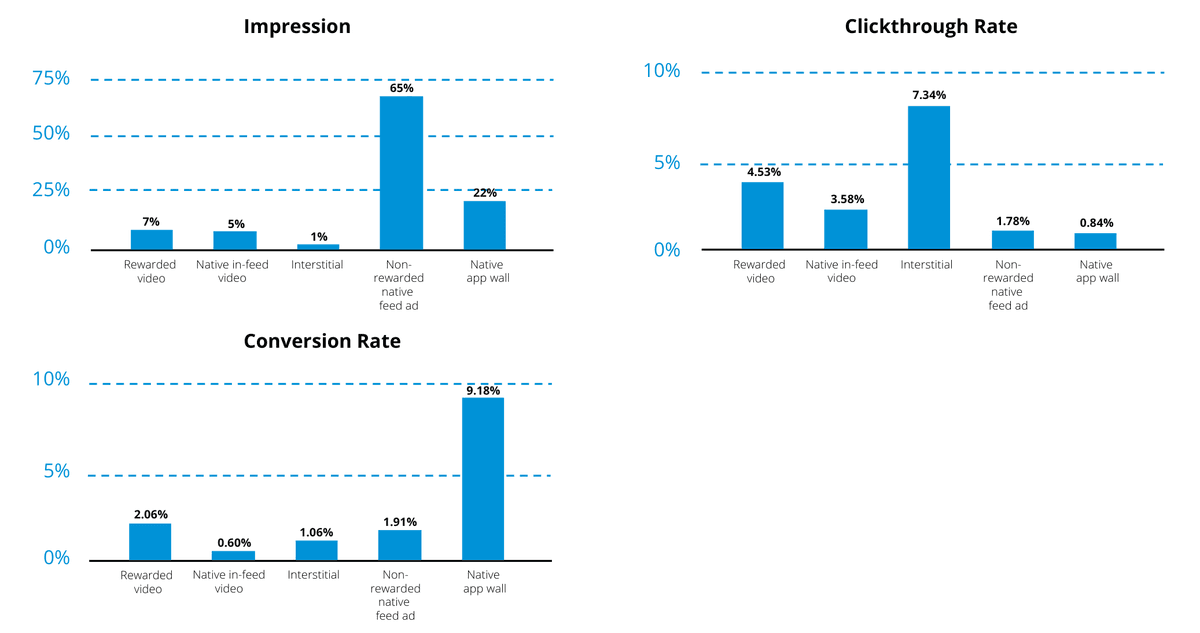
Performance marketers must match each mobile format to its natural funnel stage rather than optimizing solely for cheap clicks:
| SEA Mobile Ad Format (Mobvista) | Impression Share | Click-Through Rate (CTR) | Conversion Rate (CVR) | Optimal Funnel Role |
|---|---|---|---|---|
| Non-rewarded native feed | 65% | 1.78% | 1.91% | Scalable, non-intrusive reach inside content feeds |
| Native app wall | 22% | 0.84% | 9.18% | High-intent reward seekers delivering peak downstream conversion |
| Rewarded video | 7% | 4.53% | 2.06% | Opt-in gaming value exchange balancing strong CTR and CVR |
| Native in-feed video | 5% | 3.58% | 0.60% | Upper-funnel brand storytelling and awareness |
| Interstitial (full-screen) | 1% | 7.34% | 1.06% | High raw CTR, but prone to accidental taps if poorly capped |
How do 6 hours and 42 minutes of daily online time translate into purchases?
According to We Are Social (2019), Vietnamese Internet users spent an average of 6 hours and 42 minutes online each day (matching the global benchmark), including 2 hours and 33 minutes on social media, 2 hours and 31 minutes streaming TV or video-on-demand, and 1 hour and 11 minutes streaming music. Multi-year tracking by GlobalWebIndex shows daily social media usage climbed from 1 hour and 47 minutes in 2012 before stabilizing around 2 hours and 33–36 minutes between 2016 and 2019, placing Vietnam 21st worldwide.
Measured as a share of total daily media exposure in Q&Me's 2019 survey, mobile Internet captured 42% and desktop Internet captured 30%—giving digital channels 72% of consumer attention, more than triple traditional television (20%) and other media (8%).
Ad click drivers, accidental-tap waste, and the 3-second mobile load threshold
Understanding why users open social platforms explains why hard-sell brand posts struggle organically. Q&Me (2019) found Vietnamese users log onto social networks primarily to keep up with friends and family (76%), follow current events (48%), read entertainment news (39%), make new friends (30%), and share photos or videos (26%). Only 11% use social media to follow brands, and just 9% follow celebrities.
Even without following brand pages, Vietnamese consumers respond actively to well-targeted paid placements. Q&Me (2019) reports that users click ads most frequently on Facebook (53%), YouTube (42%), and mobile apps (20%); 64% had clicked a Facebook ad within the prior seven days, and 51% had purchased a product after seeing social media advertising. Thirty-day Facebook engagement benchmarks from We Are Social (2019) also show female users outperforming male users across monthly ad clicks (~12 vs. ~9), post likes (~9 vs. ~6), and comments (~7 vs. ~4).
At the same time, Q&Me's breakdown of why users click ads highlights a major source of mobile media waste:
- Genuine intent stems from relevance and creative craft. Top positive click triggers include product fit with current needs (45%), eye-catching visuals (40%), humorous storytelling (30%), affinity for a favorite brand (28%), and compelling promotions (27%).
- Roughly a quarter of mobile clicks carry zero purchase intent. Twenty-eight percent of respondents clicked only because an ad gated access to desired content, while 24% admitted clicking ads purely by accident on touchscreens.
Once an intentional click occurs, landing-page speed dictates conversion survival. Google and Kantar's Southeast Asian mobile shopping study (2018) found 59% of consumers research products on smartphones prior to purchase, 79% look up product information online while shopping (including inside physical stores), and 53% buy online via mobile phones. Crucially, 53% abandon a mobile site that takes longer than 3 seconds to load, and mobile conversion rates drop by 20% for every additional second of load delay.
Five digital advertising trends from 2020 and budget priorities for brands
Chapter 4 of Adsota's study—paired with its ecosystem maps spanning domestic agencies and ad networks (Adsota, Admicro, Adtima, 24H, CleverAds, Novaon, SEONGON, MediaZ, Ureka Media), e-wallets (Appota, MoMo, VNPay, AirPay, ViettelPay), and creator networks—identifies five structural shifts reshaping media execution from 2020 onward.
Short vertical video, audio spots, social commerce, micro-influencers, and CRM data
Brands adapting their media playbooks should prepare for five converging shifts:
- Short vertical video and 30-second audio ads. Rapid youth adoption of TikTok and IGTV elevated sub-60-second vertical videos engineered around a three-second hook. Simultaneously, 30-second audio spots (55–70 words plus a clear call to action) on Spotify and Zing MP3 tap screen-free moments; industry benchmarks cited in the report note 78% of Vietnamese smartphone users stream music and 68% listen while multitasking.
- Social commerce via shoppable posts. Native price tags and product catalogs on Facebook, Instagram, and Pinterest compress discovery and checkout directly inside social feeds.
- Budget reallocation toward micro-influencers (under 50,000 followers). Rather than concentrating budgets exclusively on mega-celebrities (1M+ followers) or macro-creators (250K–1M), brands increasingly scale niche advocates via platforms and MCNs such as OTA Network, Minet, 7Saturday, Hiip, CastingAsia, Metub, and ViralWorks. Reference benchmarks in the report indicate creators under 30,000 followers generate roughly 60% higher engagement at six to seven times lower cost. Marketers can pair these benchmarks with our framework for choosing between KOLs and KOCs in Vietnam.
- Data-driven marketing and CRM lifecycle personalization. Centralizing behavioral data inside CRM systems enables personalized multi-touch nurturing across B2B, financial services, real estate, and high-consideration verticals such as data-driven education marketing and lead nurturing.
- Interactive content led by real-time livestreaming. Pairing gaming streamers and micro-influencers across Facebook Gaming, YouTube, Nimo TV, and marketplace live channels turns passive impressions into real-time Q&A and instant checkout.
Four execution priorities for marketing and media-buying teams
Translating Adsota's 2019 dataset into higher return on ad spend requires four operational disciplines:
- Design mobile-first video creatives tailored to generational platform splits. With 67.1% of digital spend on mobile and video posts earning 6.55% engagement, teams should build vertical video natively for TikTok and Instagram to capture Gen Z while leveraging Zalo (90% Millennial, 86% Gen X) for working-age decision-makers.
- Audit click quality and enforce sub-3-second mobile landing pages. Because 24% of ad clicks stem from accidental taps and 28% from forced content gates, media buyers must optimize toward verified post-click conversions rather than raw CPC, while deploying lightweight mobile architectures (RWD, AMP, PWA) to prevent losing 20% of conversions per second of delay.
- Combine native feed scale with high-converting rewarded formats. Pair Non-rewarded native feed placements (65% impression share) for broad discovery with Rewarded video (4.53% CTR; 2.06% CVR) and Native app walls (9.18% CVR) for performance app installs and lead capture.
- Integrate marketplace storefronts with creator livestreams and niche seeding. Combine domestic marketplace traffic with micro-influencer seeding and live commerce events, and benchmark ongoing campaign playbooks across our marketing and creator economy hub.
This web edition synthesizes the verified market indicators and strategic takeaways from Adsota's annual study. Complete the download form on this page to access the full 51-page PDF compiled by Adsota, including full segment charts and high-resolution ecosystem maps of Vietnam's digital marketing and mobile app landscape.
Sources
- Báo cáo thị trường quảng cáo số tại Việt Nam 2019 (Vietnam Digital Advertising Report 2019), Công ty Cổ phần Adsota (Appota Group), 2020-02-20, accessed 2026-10-31
- Digital 2019 & Digital 2020: Vietnam, We Are Social & Hootsuite (DataReportal), 2020-02-18, accessed 2026-10-31
- Mobile & Tablet Vendor and Operating System Market Share Viet Nam (2017–2019), StatCounter Global Stats & GfK, 2019-12-31, accessed 2026-10-31
- Global Mobile Market Report 2019 — Top Countries/Markets by Smartphone Users, Newzoo, 2019-09-19, accessed 2026-10-31
- Leading Countries in App Downloads Q2 2019 & Vietnam App Store Rankings 2019, AppTweak, Applyzer & App Annie (data.ai), 2019-12-15, accessed 2026-10-31
- Global Digital Ad Spending 2019 & Vietnam Media/Mobile Ad Spending Forecast (2018–2022), eMarketer (Insider Intelligence), 2019-03-28, accessed 2026-10-31
- Digital Advertising Spending in Vietnam by Industry 2019, Statista, 2019-11-01, accessed 2026-10-31
- Bản đồ Thương mại điện tử Việt Nam (Map of E-commerce in Vietnam Q3/2017 – Q3/2019), iPrice Group, 2019-10-25, accessed 2026-10-31
- Vietnam Social Media Usage, Online Video Marketing & Digital Advertising Surveys (2017–2019), Q&Me (Asia Plus Inc.), 2019-11-15, accessed 2026-10-31
- Vietnam Video Metrix 2019, The Connected Consumer 2019 & Daily Social Media Time (2012–2019), Comscore, Decision Lab & GlobalWebIndex, 2019-10-30, accessed 2026-10-31
- Asia Mobile Ad Inventory, SEA Mobile Ad Format Benchmarks & SEA Mobile Consumer Journey, Vpon Big Data Group, Mobvista & Google / Kantar, 2018-12-01, accessed 2026-10-31