
ReportsCorporate & Digital Economy
Vietnam Mobile and Smartphone Application Market Report H1 2020
Appota's H1 2020 report on the Vietnam mobile and smartphone market examines how pandemic lockdowns accelerated mobile adoption across hardware, gaming, advertising, and digital commerce. Vietnam reached roughly 50 million smartphone users (45% of the population), 40 million mobile gamers, USD 211 million in projected mobile ad spend, and VND 4.9 quadrillion in H1 electronic payment value (+178% year-on-year).
An executive analysis of Vietnam's 50 million smartphone users, 40 million mobile gamers, USD 211 million mobile ad spend, and VND 4.9 quadrillion digital payment surge in H1 2020 from Appota.
Key findings
- 45% (~50M users)Share of Vietnam's population using smartphones in 2020 (ranking 15th globally at 4 hours per day), backed by 70% Internet penetration where 97% of users connect via mobile devices (Newzoo, We Are Social, Q&Me).
- 69% under VND 5MShare of official retail smartphones sold in Vietnam priced below VND 5 million (21% under VND 3M, 48% at VND 3–5M), underpinning Android's 60.8% operating system share in June 2020 (Appota compilation, StatCounter).
- 33.12 Mbps (#2 ASEAN)Vietnam's average mobile Internet speed, ranking second across nine ASEAN markets behind Singapore (56.95 Mbps), alongside 54.67 Mbps in fixed broadband at fourth regionally (Appota compilation).
- 40M mobile gamersEstimated mobile game players in Vietnam in 2020 (80% of all gamers nationwide, averaging 51 minutes per session across 51% male and 49% female players), with Q1 2020 game downloads jumping 40% YoY (Decision Lab, App Annie, Gamota).
- USD 211MProjected 2020 mobile advertising spend in Vietnam, accounting for roughly 67.8% of total digital ad spend (USD 311.22M) and ranking sixth in Southeast Asia, while 61% of Vietnamese apps monetize via ads (eMarketer, IAB, MMA Global, Adsota, 42matters).
- USD 0.06 & USD 0.15Average mobile game cost per install (CPI) in Vietnam in March 2020 on Google Play (USD 0.06) and iOS (USD 0.15), paired with 256,290 average downloads per app—65% higher than the global average (Appota compilation).
- VND 4.9 quadrillionTotal electronic payment transaction value in Vietnam during H1 2020 (+178% YoY as transaction volume rose 76%), including 472 million smartphone payment transactions, up 177% YoY (State Bank of Vietnam).
Why did the Vietnam mobile and smartphone market anchor digital resilience in H1 2020?
The first half of 2020 marked a structural turning point for the Vietnam mobile and smartphone market as COVID-19 social distancing shifted daily commerce onto handheld screens. According to the National Statistics Office — Ministry of Finance (then the General Statistics Office), Vietnam posted positive H1 2020 GDP growth of 1.81% after 7.02% growth in 2019. Six-month average CPI rose 4.19% year-on-year, with June 2020 CPI up 3.17%.
Forecasts compiled by PwC in April 2020 highlighted Vietnam's regional resilience. Major institutions projected full-year positive GDP expansion for Vietnam—led by ADB at 4.8%, Fitch at 3.3%, and the IMF at 2.7%—while projecting contractions across Thailand (-6.7%), the United States (-5.9%), and Japan (-5.2%).
Demographics underpinned domestic digital demand across a population of 97.33 million (15th globally, 37.7% urban, median age 32.5 per Worldometer and World Population Review). With GDP per capita at USD 2,518 (Indochina Research), 80% of citizens fell within ages 16–65, led in smartphone adoption by Millennials aged 25–39 (25%) and Gen Z aged 16+ (12%).
High-speed mobile connectivity and three-carrier telecom concentration
Benchmarks from Newzoo, We Are Social, and Q&Me show 70% of Vietnam's population using mobile phones (~150 million connections). Smartphone penetration reached 45% (~50 million users, 15th worldwide), with 53% of smartphone users subscribing to 3G or 4G mobile data.
Vietnam operated as a mobile-first internet economy: 70% of citizens used the Internet, and 97% of internet users connected via mobile devices (52% male, 48% female; 30% urban, 70% rural). Daily smartphone usage averaged 4 hours, led by social media (94%), messaging (93%), video entertainment (85%), gaming (58%), and shopping (55%).
Across nine ASEAN countries compared, Vietnam ranked fourth in overall internet speed and second in mobile broadband. Mobile speeds averaged 33.12 Mbps—trailing only Singapore (56.95 Mbps) and ahead of Thailand (33.04 Mbps)—while fixed broadband averaged 54.67 Mbps (fourth regionally). Per the 2019 Vietnam ICT Whitebook (Ministry of Science and Technology), Viettel held 50.16% of 3G/4G subscribers, ahead of VNPT (22.93%), MobiFone (19.85%), Vietnamobile (6.61%), and Indochina Telecom (0.45%).
The smartphone share paradox between official retail sales and active devices
Product teams entering Vietnam frequently misread device purchasing power by looking only at iOS web-traffic share. Comparing Appota's price-tier data with GfK retail figures and StatCounter active-device metrics reveals a sharp split between authorized new retail sales and active handsets.
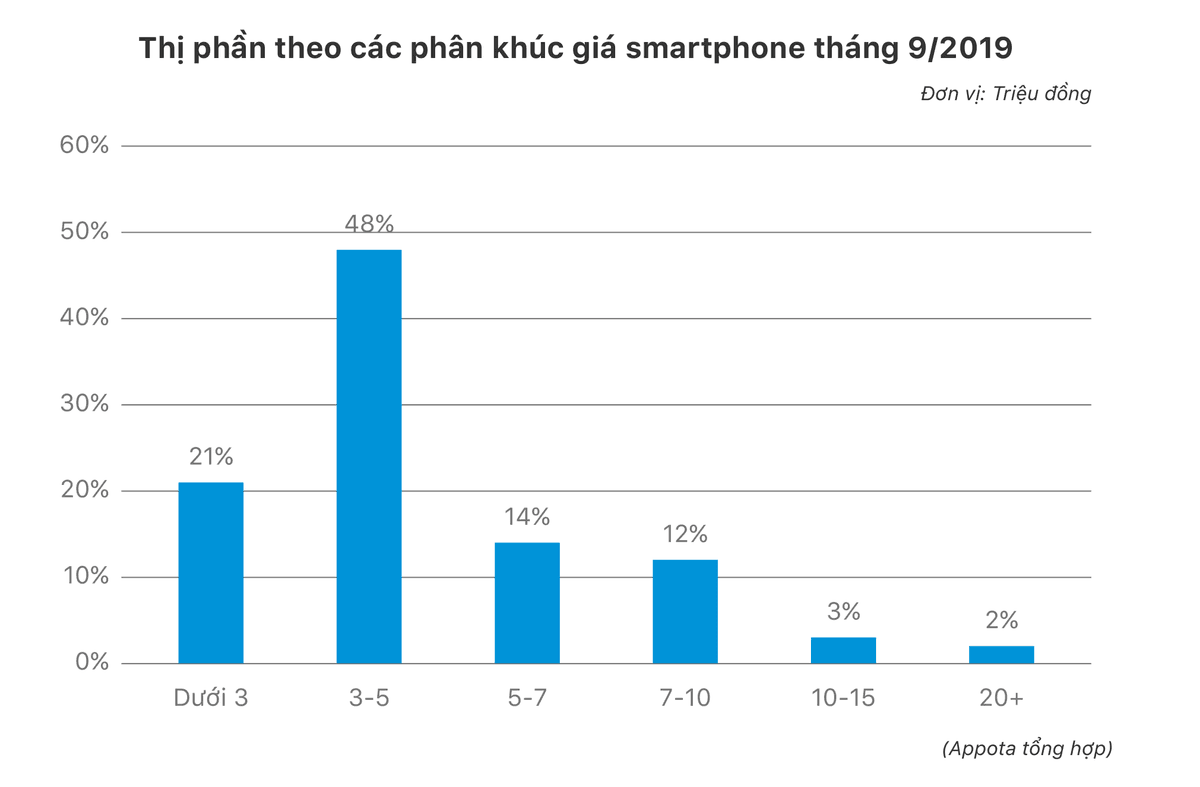
Price-segment tracking from September 2019 compiled by Appota shows 69% of official-channel smartphones sold below VND 5 million. Premium handsets priced at VND 10 million and above represented just 5% of authorized retail unit volume:
| Vietnam Smartphone Metric | Leading Brands / Tiers | Recorded Share | Source & Period |
|---|---|---|---|
| Official retail price tiers | Under 3M / 3–5M / 5–7M / 7–10M / 10M+ VND | 21% / 48% / 14% / 12% / 5% | Appota (09/2019) |
| Mobile OS share (web traffic) | Android / iOS / Windows Phone | 60.8% / 38.4% / 0.8% | StatCounter (06/2020) |
| Official new retail unit sales | Samsung / Oppo / Vinsmart / Vivo / Xiaomi / Apple | 31.1% / 22.4% / 16.7% / 7.7% / 5.5% / 5.2% | GfK (Q1 2020) |
| Active installed handset share | iPhone / Samsung / Oppo / Xiaomi / Huawei | 38.55% / 27.64% / 10.47% / 9.47% / 2.77% | StatCounter (06/2020) |
In GfK's Q1 2020 official retail readout, Samsung (31.1%), Oppo (22.4%), and domestic brand Vinsmart (16.7%) led new unit sales while Apple stood at 5.2%. Yet StatCounter's June 2020 active-device data recorded iPhone at 38.55% (iOS at 38.4% behind Android's 60.8%), reflecting multi-year iPhone lifecycles alongside large gray-market and secondhand iPhone inflows.
Lockdown app-store surges across cloud video, public health, and TikTok
Globally, App Annie reported H1 2020 app and game downloads rose 10% over H2 2019. Monthly installs peaked in April 2020 at 12.0 billion (7.1 billion apps and 4.9 billion games), 25% above the 2019 monthly average.
In Vietnam, Facebook led popular app share at 31%, followed by YouTube (13%), Messenger (11%), and Zalo (10%). From January to April 2020, Zoom and health-declaration app NCOVI topped local download charts before privacy concerns shifted enterprise teams toward Microsoft Teams and Google Meet. Over the same period, TikTok passed 2 billion global installs and ranked third in Vietnam's April downloads, boosted by #ONhaVanVui and the viral Ghen Cô Vy dance.
How did mobile gaming polarize as Q1 2020 downloads jumped 40% while new releases slowed?
Decision Lab estimates place Vietnam's 2020 mobile gaming audience at 40 million players—80% of all gamers nationwide—averaging 51 minutes per session. Gender distribution was nearly balanced at 51% male and 49% female, led by ages 16–24 (39%) and 25–34 (33%), ahead of 35–44 (14%), 45–54 (9%), and 55+ (6%).
We Are Social (2020) confirmed 85% of Vietnamese internet users aged 16–64 played games on smartphones, far ahead of PC/laptops (50%), tablets (26%), and consoles (9.1%). Applyzer's July 2020 category data highlighted Android's gaming dominance: Games drove 81.2% of top-downloaded category volume on Google Play versus 45.7% on the App Store.
Incumbent publishers and established esports franchises captured lockdown traffic
During Q1 2020, Vietnam mobile game downloads jumped 40% year-on-year while player counts grew 30% (App Annie, Gamota, 2game.vn). Yet 2game.vn tracking showed quarterly domestic game launches falling from 63 titles in Q4 2019 to 58 in Q1 2020 and 54 in Q2 2020 as overseas development pipelines stalled.
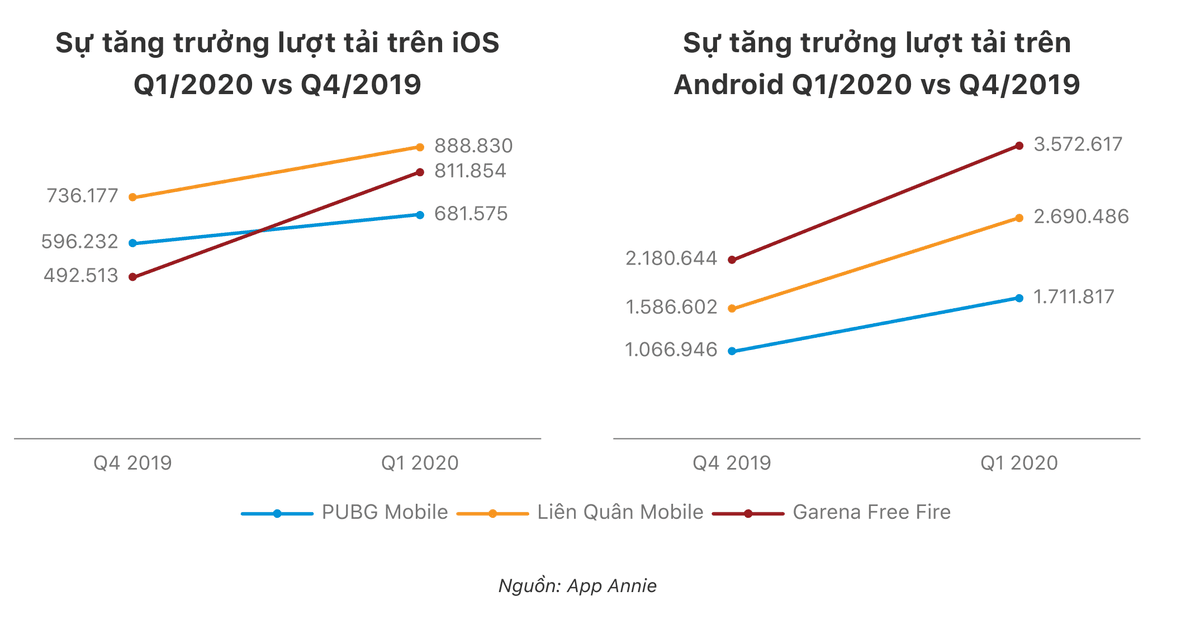
While smaller publishers struggled with delayed short-lifecycle releases, large publishers operating free-to-play esports titles absorbed stay-at-home demand. Per Reputa and App Annie, Vietnam's three most-played lockdown games posted sharp Q1 2020 install growth:
| Flagship Esports Title | iOS Q4 2019 | iOS Q1 2020 | Android Q4 2019 | Android Q1 2020 | Android Q1/Q4 Ratio |
|---|---|---|---|---|---|
| Garena Free Fire | 492,513 | 811,854 (+64.8%) | 2,180,644 | 3,572,617 (+63.8%) | 163.8% |
| Arena of Valor (Liên Quân) | 736,177 | 888,830 (+20.7%) | 1,586,602 | 2,690,486 (+69.6%) | 169.6% |
| PUBG Mobile | 596,232 | 681,575 (+14.3%) | 1,066,946 | 1,711,817 (+60.4%) | 160.4% |
On Android, Q1 2020 downloads across these three titles averaged roughly 165% of Q4 2019 volume (+60.4% to +69.6% net growth). July 2020 rankings from SimilarWeb and AppTweak remained anchored by long-running hits including Coin Master, PUBG Mobile VN, Lords Mobile (co-published with Gamota), Free Fire, Liên Quân Mobile, Rise of Kingdoms, and MU Đại Thiên Sứ H5.
Gaming livestream audiences outgrew active player bases on Facebook Gaming
Adsota research revealed that 52% of Vietnamese esports and game-stream viewers watched titles they did not personally play. Streaming audiences therefore extended well beyond active player cohorts.
During social distancing, Facebook Gaming in Vietnam posted an 81.37% jump in total views, 79.6% higher reach, and 50% higher engagement (Adsota). OTA Network creator Nam Blue set a standout milestone of 137,000 peak concurrent viewers (CCV).
How did low CPIs and rewarded video shape Vietnam's USD 211 million mobile advertising market?
Forecasts from eMarketer and IAB placed Vietnam's 2020 digital ad spend at USD 311.22 million, led by mobile advertising at USD 211 million (~67.8% share). Projections from MMA Global and Adsota tracked mobile ad spend climbing from USD 190 million (2019) to USD 211 million (2020), USD 227 million (2021), and USD 236 million (2022).
Regionally, Vietnam ranked sixth in Southeast Asia in 2020 behind Singapore (USD 400M), Indonesia (USD 367M), Thailand (USD 343M), the Philippines (USD 289M), and Malaysia (USD 248M). According to 42matters, 61% of Vietnamese apps monetized via advertising (global average 39%), ahead of in-app purchases at 17% (global 4%) and paid downloads at 10% (global 3%).
Ultra-low game CPIs and budget shifts toward performance ads and news portals
In MMA's 2020 survey, 47% of businesses raised digital media budgets during COVID-19, 31% boosted promotions, 28% expanded online sales, and 25% adapted logistics. Brands prioritized direct-response conversion ads while reduced auction pressure cut average Q1 2020 Facebook CPM by 57% versus Q4 2019 (Statista).
Pandemic news demand lifted Q1 2020 visits at Vietnamese general news sites by 28%–44% and business-finance portals by 39%, matching a 52% global increase in news-site ad budgets (Influencer Marketing Hub). Meanwhile, Vietnam averaged 256,290 downloads per app—65% above the 154,794 global average—while mobile game CPI declined from USD 0.09 (January 2019) to USD 0.06 (March 2020) on Google Play and from USD 0.29 to USD 0.15 on iOS.
Android rewarded-video eCPM recovery and compact screen optimization
Appodeal's January–May 2020 Google ad-network index showed contrasting platform recoveries after the March 2020 global ad slump.
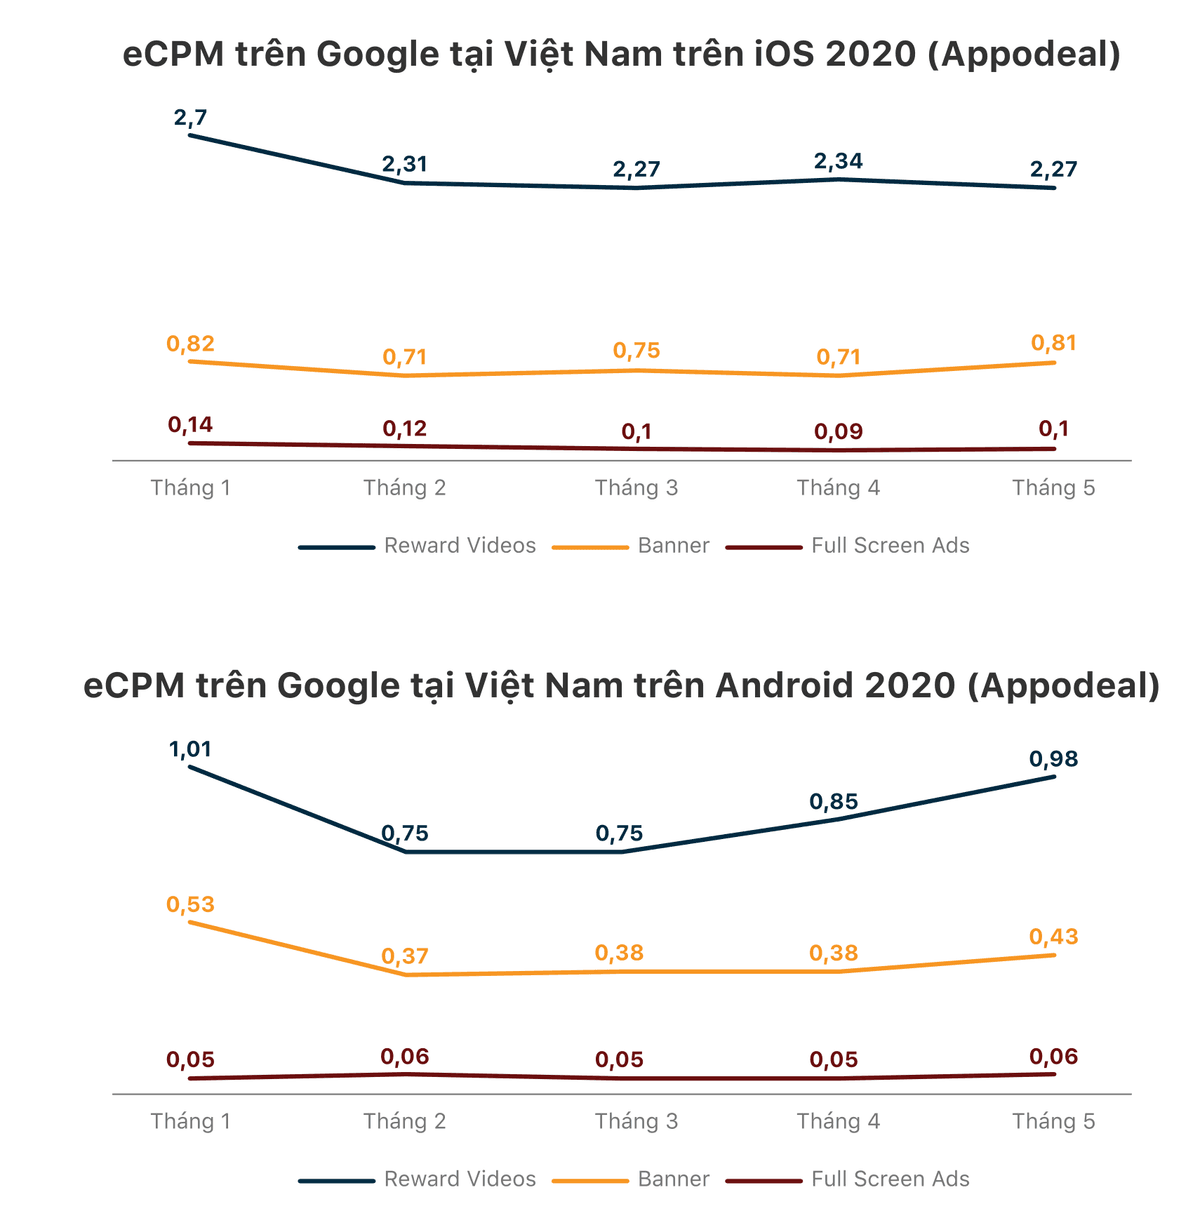
Monthly eCPM across Vietnam's three core ad formats moved as follows:
| Platform & Format | Jan 2020 | Feb 2020 | Mar 2020 | Apr 2020 | May 2020 |
|---|---|---|---|---|---|
| iOS — Reward Videos | USD 2.70 | USD 2.31 | USD 2.27 | USD 2.34 | USD 2.27 |
| iOS — Banner | USD 0.82 | USD 0.71 | USD 0.75 | USD 0.71 | USD 0.81 |
| iOS — Full Screen Ads | USD 0.14 | USD 0.12 | USD 0.10 | USD 0.09 | USD 0.10 |
| Android — Reward Videos | USD 1.01 | USD 0.75 | USD 0.75 | USD 0.85 | USD 0.98 |
| Android — Banner | USD 0.53 | USD 0.37 | USD 0.38 | USD 0.38 | USD 0.43 |
| Android — Full Screen Ads | USD 0.05 | USD 0.06 | USD 0.05 | USD 0.05 | USD 0.06 |
While iOS Rewarded Video eCPM dipped from USD 2.70 to USD 2.27 in May, Android Rewarded Video rebounded from USD 0.75 in February–March to USD 0.98 in May, driven by heavy Android gaming engagement. For ad creative sizing, StatCounter data showed four compact viewports—360x640 (37.78%), 414x736 (17.30%), 375x667 (11.29%), and 412x846 (9.92%)—covering 76.29% of active Vietnamese smartphones.
What drove Vietnam's 178% surge in digital payment transaction value during H1 2020?
Prior to 2020, Decision Lab data among Vietnamese aged 15+ showed 30% holding bank accounts, 26% using debit cards, 4.2% holding credit cards, and 21% having paid online. Lockdown ordering and interbank fee reductions triggered rapid cashless adoption.
According to the State Bank of Vietnam, H1 2020 electronic payment volume rose 76% year-on-year while transaction value jumped 178% to VND 4.9 quadrillion. Smartphone payments reached 472 million transactions (+177% YoY). Daily April e-banking volume doubled from 15 million to 30 million transactions, and H1 NAPAS switching rose 138% in volume and 140% in value.
Contactless card adoption and post-subsidy e-wallet retention
Visa reported 2020 contactless transaction value in Vietnam surged 600% year-on-year alongside a 500% jump in transaction count and a 300% rise in active contactless cards. Among domestic payment platforms, Q2-over-Q1 2020 transaction volume grew 50% at MoMo, 36% at ZaloPay, and 30% at NganLuong.vn.
Crucially, IDC Financial Insights survey results dispelled fears that wallet users churn once subsidies stop: across three surveyed wallet user groups, 84% to 95% intended to keep using e-wallets even without promotions.
How did mobile e-commerce and livestream shopping reshape Vietnamese consumer behavior?
Per the 2020 Vietnam E-Commerce Whitebook (Ministry of Industry and Trade), online shoppers grew from 33.6 million (2017) to 39.9 million (2018) and 44.8 million (2019), with annual per-shopper spend rising from USD 186 to USD 225. Between 2017 and 2019, smartphone share of e-commerce orders jumped from 46% to 72% while PC/laptop share fell from 42% to 15% (Decision Lab).
Marketplace traffic divergence and essential-category reallocation
Traffic data from iPrice Insights in H1 2020 revealed widening divergence across Vietnam's four largest marketplaces:
| Marketplace | Q4 2019 Monthly Visits | Q1 2020 Monthly Visits | Q2 2020 Monthly Visits | Category Breadth |
|---|---|---|---|---|
| Shopee | 38M | 43M | 52M (136.8% of Q4 2019) | 25 categories |
| Tiki | 24M | 23M | 21M | 16 categories |
| Lazada | ~24M–27M | 19M | 18M | 12 categories |
| Sendo | 27M | 17M | 14M | 18 categories |
While rival platforms eased from Q4 holiday highs, Shopee climbed to 52 million monthly visits in Q2 2020. Decision Lab's survey of marketplace selection drivers explains why:
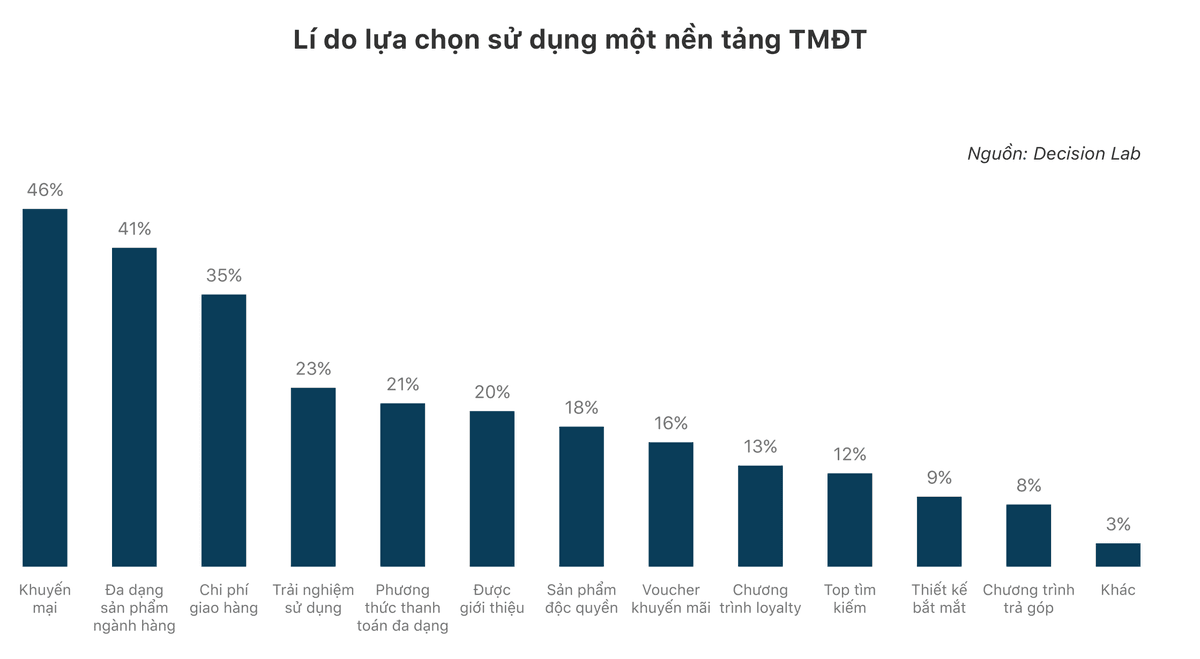
Promotions ranked first (46%), followed by product variety (41%), shipping costs (35%), user experience (23%), and payment diversity (21%). Covering 25 categories enabled Shopee to capture shifting lockdown demand as Q1 2020 Groceries traffic surged 45% and Cosmetics with health care rose 32%, while Fashion fell 38% (Decision Lab).
BoxMe data recorded e-wallets reaching 11% of e-commerce transaction value alongside bank transfers at 30%. Confirming lasting habit change, Rakuten Insight found 91% of consumers planned to continue shopping online post-pandemic, led by positive experiences (28.99%) and convenience (22.24%).
Livestream commerce campaigns and Sunday prime-time conversion peaks
In April 2020 across Southeast Asia, Shopee Live drew 35 million views and Lazada Live reached 27 million views. In Vietnam, Shopee ran Shopee Tết Show, Siêu hội Shopee Live, and Shopee Live Kpop Fest; Lazada streamed an 88-hour continuous Guess It gameshow; Tiki expanded Tiki Live merchant broadcasts; and Sendo partnered with OTA Network on Săn sale nửa giá – Streamer tranh bá via SenLive.
Operational metrics from Shopee Vietnam identified Sunday nights from 9:00 PM to 10:00 PM as peak concurrent viewership (CCV) prime time. Ages 18–34 anchored viewership, accompanied by rapid growth among 34–50-year-old shoppers.
Four structural lessons from H1 2020 for mobile product and growth teams in Vietnam
Appota's H1 2020 benchmarks establish four execution priorities for product, marketing, and payment leaders operating in Vietnam:
- Optimize client builds and UI layouts for sub-VND 5 million Android handsets. With 69% of new authorized smartphones priced under VND 5 million and compact viewports driving 76% of traffic, teams should validate stability, retention, and payback via our three-gate mobile game soft-launch checklist.
- Combine rewarded-video monetization with micro-influencer and livestream commerce. To convert broad streaming audiences into buyers, marketers should align creator tiers with conversion goals using our decision framework for choosing KOLs versus KOCs in Vietnam.
- Streamline mobile wallet checkout and automate daily settlement reconciliation. Supporting 177% smartphone payment growth and 84%–95% wallet retention requires secure checkout architecture from our payment gateway integration checklist for websites and mobile apps paired with our daily payment reconciliation guide for enterprises.
- Track multi-year digital economy shifts against updated sector benchmarks. Decision-makers can compare H1 2020 inflection data with newer industry research across our corporate and Vietnam digital economy hub.
This web report distills the verified market metrics and data-hygiene notes from Appota's H1 2020 study. Complete the download form on this page to receive the full 64-page PDF compiled by Appota's market research team, featuring nine-country ASEAN broadband charts, full storefront rankings, and Vietnam mobile ecosystem maps across Gamota, Adsota, OTA Network, AppotaPay, and KDATA.
Sources
- Báo cáo thị trường điện thoại & ứng dụng di động Việt Nam H1-2020 (Vietnam Mobile and Smartphone Application Report H1-2020), Công ty Cổ phần Appota (Đội ngũ nghiên cứu thị trường Appota), 2020-10-26, accessed 2026-10-31
- Báo cáo tình hình kinh tế – xã hội quý II và 6 tháng đầu năm 2020, Cục Thống kê — Bộ Tài chính, 2020-06-29, accessed 2026-10-31
- Sách trắng Công nghệ thông tin và Truyền thông Việt Nam 2019, Bộ Khoa học và Công nghệ, 2019-10-01, accessed 2026-10-31
- Digital 2020: Vietnam, We Are Social & Hootsuite (cùng Newzoo, Q&Me), 2020-02-18, accessed 2026-10-31
- Mobile Operating System, Vendor & Screen Resolution Market Share Viet Nam (June 2020), StatCounter GlobalStats (cùng GfK), 2020-07-01, accessed 2026-10-31
- H1 2020 Global & Vietnam Mobile App and Game Download Benchmarks, App Annie / data.ai (cùng AppTweak, Applyzer, SimilarWeb, 2game.vn, Reputa), 2020-07-15, accessed 2026-10-31
- Vietnam Mobile Gaming, Financial Inclusion & E-Commerce Consumer Surveys 2020, Decision Lab, 2020-06-15, accessed 2026-10-31
- Southeast Asia Digital & Mobile Advertising Spending Forecast 2019–2022, eMarketer & IAB Southeast Asia and India (cùng MMA Global, Adsota), 2020-05-01, accessed 2026-10-31
- Mobile App Monetization & Vietnam In-App Advertising eCPM Index H1 2020, Appodeal & 42matters (cùng Statista, Influencer Marketing Hub), 2020-06-30, accessed 2026-10-31
- Thống kê hoạt động thanh toán không dùng tiền mặt và chuyển mạch NAPAS 6 tháng đầu năm 2020, Ngân hàng Nhà nước Việt Nam & NAPAS (cùng Visa, IDC Financial Insights), 2020-07-20, accessed 2026-10-31
- Sách trắng Thương mại điện tử Việt Nam năm 2020, Cục Thương mại điện tử và Kinh tế số — Bộ Công Thương, 2020-08-15, accessed 2026-10-31
- Bản đồ Thương mại điện tử Việt Nam (Map of E-commerce in Vietnam) quý 1 – quý 2/2020, iPrice Insights (cùng BoxMe, Rakuten Insight), 2020-07-28, accessed 2026-10-31