
Vietnam Mobile Marketing and Game Report 2019
Appota's 2019 Vietnam mobile marketing and game report finds mobile advertising reached USD 411.06 million (62% of digital spend), backed by APAC's lowest average CPI at USD 0.25 on iOS and USD 0.10 on Android. Across 51 million mobile Internet users, 33 million mobile gamers generated USD 365 million in official store revenue.
An executive analysis of APAC's lowest CPI benchmarks, USD 411.06M mobile ad spend, USD 365M game store revenue, Gen Z gamer habits, and Q1 2019 device data.
Key findings
- USD 0.25 & USD 0.10Vietnam's average app Cost Per Install (CPI) on iOS (USD 0.25) and Android (USD 0.10)—the lowest across eight benchmarked Asia-Pacific markets (Chartboost)—alongside ranking 8th globally in Android downloads and 10th on iOS through February 2019 (App Annie).
- USD 411.06M (62%)Mobile advertising expenditure in Vietnam in 2018 out of USD 663 million in total digital ad spend, projected to reach USD 577.5 million in 2019 (66% of USD 875M) and USD 767.9 million in 2020 (70% of USD 1,097M) according to Statista and ExchangeWire.
- 84% social ad shareSocial media advertising captured USD 557.1 million in 2018 across 45 million social users and was projected to grow 33.6% to USD 744.3 million in 2019—far ahead of Search Ads (8.8%; USD 58.4M), Website Banners (5.3%; USD 35.2M), and Non-social Video (1.7%; USD 11.2M, up 84% YoY) (Statista).
- 51% rewarded videoUser likeability for rewarded mobile video ads—more than double non-rewarded video (23%) and ahead of rewarded interactive interstitials (44% vs. 20%) and rewarded static interstitials (41% vs. 18%), with an acceptable average video duration of 19 seconds (POKKT, Decision Lab).
- USD 365M store revenueOfficial app-store mobile game revenue in Vietnam in 2018—nearly doubling from USD 183 million in 2015 (excluding card/gambling titles and local third-party billing) even as officially licensed imported game releases fell from 216 in 2016 to 160 in 2018 (Newzoo, GameK).
- 33M mobile gamersActive mobile gamers in Vietnam in 2018 (one in two Internet-connected phone users, projected to reach 40 million by 2020); gaming led daily smartphone time at 23% of 3 hours 42 minutes, ahead of social media at 18% (Statista, MMA, POKKT, Appota).
- 402,000 watch hrs/dayAverage daily non-tournament game livestream watch time in H1 2019 (reaching 21.5 million monthly hours in May 2019, with 61% viewed on mobile devices per Appota Esports), alongside 18 million eSports players and 8 million regular viewers projected for 2019 (Appota).
- 41.62% Apple shareApple led active mobile and tablet device vendor share in Q1 2019 (ahead of Samsung at 26.06% and Oppo at 7.18%), while Android held 55.10% OS share across heavily fragmented legacy versions led by Android 7.0 Nougat (20.79%) and 5.1 Lollipop (18.99%) (StatCounter, Appota).
What macroeconomic tailwinds powered the Vietnam mobile marketing and game landscape in 2019?
Published in June 2019, Appota's assessment of the Vietnam mobile marketing and game ecosystem rests on strong macroeconomic momentum across an estimated population of 97 million. According to the General Statistics Office of Vietnam (GSO Vietnam) and Kantar Worldpanel cited in the report, Vietnam achieved a decade-high GDP growth rate of 7.1% in 2018. Over the same year, inflation stayed controlled at 3.5% and trade in goods and services expanded 12.4%.
For 2019–2022, the report cites projections of 6–7% annual GDP growth alongside 3–4% consumer price inflation. Domestic purchasing confidence remained elevated across all four quarters of 2018, with Kantar Worldpanel's Consumer Confidence Index (CCI) recording 124, 120, 129, and 122 points from Q1 through Q4.
Fifty-one million mobile Internet users and top-ten global download volume
Expanding broadband access turned smartphones into Vietnam's primary entertainment screen. According to We Are Social and Appota data for 2018, national Internet penetration reached 66% (+9% vs. 2017). Mobile Internet penetration hit 53%, jumping from 42 million users in 2017 to 51 million by the end of 2018.
Connected Vietnamese consumers spent an average of 6 hours and 42 minutes online daily across all devices. That routine included 2 hours and 31 minutes watching livestreams and video-on-demand (Facebook, YouTube, NimoTV) plus 1 hour and 11 minutes streaming music. Network speeds averaged 27.2 Mbps on fixed-line broadband and 21.6 Mbps on mobile connections.
High engagement placed Vietnam among the world's top ten app-downloading countries on both major storefronts. Cumulative App Annie rankings through February 2019 ranked Vietnam eighth globally on Android (unchanged from 2017) and tenth on iOS (+1 spot). On Google Play, Vietnam trailed India, Brazil, the United States, Indonesia, Russia, Mexico, and Turkey, while outpacing Thailand and South Korea.
App Annie's 2018 combined iOS and Android Monthly Active User (MAU) leaders blend global social platforms with domestic apps and competitive games:
- Top 10 apps by MAU in 2018: Facebook, Facebook Messenger, Zalo, Zing Mp3, Viber, Grab, Instagram, NhacCuaTui, abPhoto, and Skype.
- Top 10 mobile games by MAU in 2018: Arena of Valor (Liên Quân Mobile), Free Fire, Candy Crush Saga, My Talking Tom, Clash of Clans, Dream League Soccer 2016, PUBG MOBILE, Minecraft Pocket Edition, Zombie Tsunami, and Tiến Lên - ZingPlay.
Why did Vietnam pair APAC's lowest CPI with rapidly rising mobile ad budgets?
Vietnam's standout user-acquisition advantage in 2018–2019 was its low entry cost per install. Across eight Asia-Pacific markets benchmarked by Chartboost, average Cost Per Install (CPI) in Vietnam stood at USD 0.25 on iOS and USD 0.10 on Android—the lowest in APAC on both platforms (tying with the Philippines on Android).
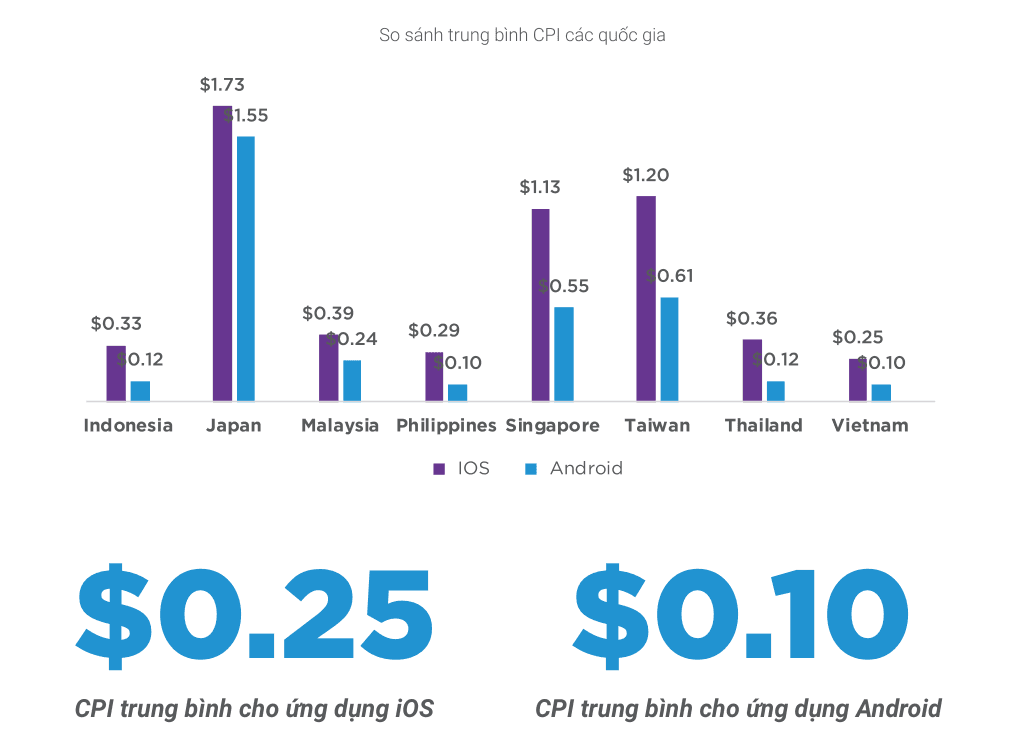
Chartboost's regional comparison shows how acquiring an install in mature East Asian markets cost roughly five to fifteen times more than in Vietnam:
| APAC Market (Chartboost) | Average iOS CPI | Average Android CPI | iOS Multiple vs. Vietnam |
|---|---|---|---|
| Japan | USD 1.73 | USD 1.55 | 6.9x Vietnam |
| Taiwan | USD 1.20 | USD 0.61 | 4.8x Vietnam |
| Singapore | USD 1.13 | USD 0.55 | 4.5x Vietnam |
| Malaysia | USD 0.39 | USD 0.24 | 1.6x Vietnam |
| Thailand | USD 0.36 | USD 0.12 | 1.4x Vietnam |
| Indonesia | USD 0.33 | USD 0.12 | 1.3x Vietnam |
| Philippines | USD 0.29 | USD 0.10 | 1.2x Vietnam |
| Vietnam | USD 0.25 | USD 0.10 | Lowest in group |
Overseas studios frequently mistake cheap CPI for guaranteed profitability. Low install costs fill the top of the funnel quickly, yet positive return on ad spend depends on Day-7 and Day-30 retention alongside local payment conversion. Teams should verify retention thresholds first using our mobile game soft-launch checklist before scaling user acquisition.
Trajectory toward USD 767.9 million in mobile ad spend and social media's 84% share
According to Statista and ExchangeWire, total digital ad spend in Vietnam reached USD 663 million in 2018, with mobile capturing USD 411.06 million (62%). Quoted in the report, Rohit Dadwal (APAC Managing Director, MMA) cited Vietnam and Southeast Asia as primary engines behind APAC's projected 45% digital ad growth in 2018.
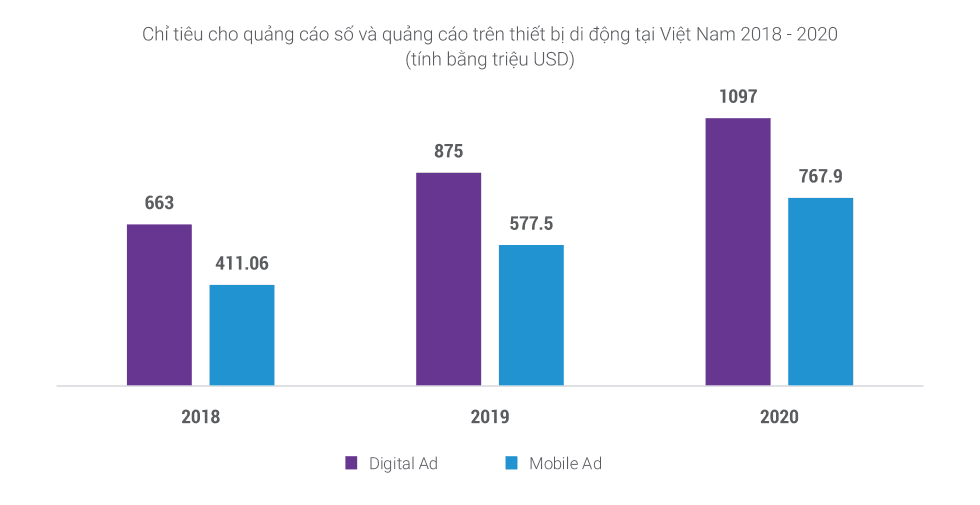
Statista and Appota's three-year outlook shows mobile capturing 70% of digital ad dollars by 2020:
| Spend Metric (Statista, ExchangeWire) | 2018 Actual | 2019 Forecast | 2020 Forecast |
|---|---|---|---|
| Total Digital Ad Spend | USD 663M | USD 875M | USD 1,097M |
| Mobile Ad Spend | USD 411.06M | USD 577.5M | USD 767.9M |
| Mobile Share of Digital | 62% | 66% | 70% |
Breaking down Vietnam's USD 663 million digital ad spend in 2018 highlights sharp format concentration:
- Social Media Ads captured 84% (USD 557.1 million): Reaching roughly 45 million users across Facebook, Instagram, and Zalo, social spend was projected to rise 33.6% to USD 744.3 million in 2019.
- Search Ads ranked second at 8.8% (USD 58.4 million): Projected to slow and contract by 2020 as Vietnamese users favor organic SEO results over paid search tags.
- Website Banner Ads held 5.3% (USD 35.2 million): Projected to grow steadily at 10–12% annually (10–20% in the Vietnamese edition) across major news portals.
- Non-social Video Ads accounted for 1.7% (USD 11.2 million): Fastest-growing segment in 2017–2018 (+84%), projected to expand 40–60% annually over five years.
Readers comparing Statista's perimeter here with eMarketer's industry-level estimates can consult Adsota's 2019 Vietnam digital advertising market report.
Rewarded in-app ad receptivity and the 19-second video threshold
Survey data from POKKT and Decision Lab shows user likeability more than doubled across every in-app format when paired with rewards:
- Mobile Video Ads: Likeability jumped from 23% (non-rewarded) to 51% for rewarded video.
- Interactive / Playable Interstitials: Likeability climbed from 20% without rewards to 44% with rewards.
- Static Interstitials: Likeability rose from 18% (forced) to 41% (rewarded).
Vietnamese mobile users considered 19 seconds an acceptable average video ad length. Keeping rewarded videos within 15–20 seconds with clear item incentives protects completion rates and retention.
What does mobile game store revenue doubling to USD 365 million amid fewer releases reveal?
According to Statista and Appota, Vietnam counted 33 million mobile gamers in 2018, projected to reach 40 million by 2020. One in two Internet-connected phone users played mobile games, and 45% of mobile gamers played eSports.
Across 3 hours and 42 minutes of average daily smartphone use tracked by MMA, POKKT, and Appota, gaming ranked first at 23% of screen time—ahead of social media (18%), video (14%), web browsing (13%), calls and messaging (8%), shopping (4%), and other tasks (20%).
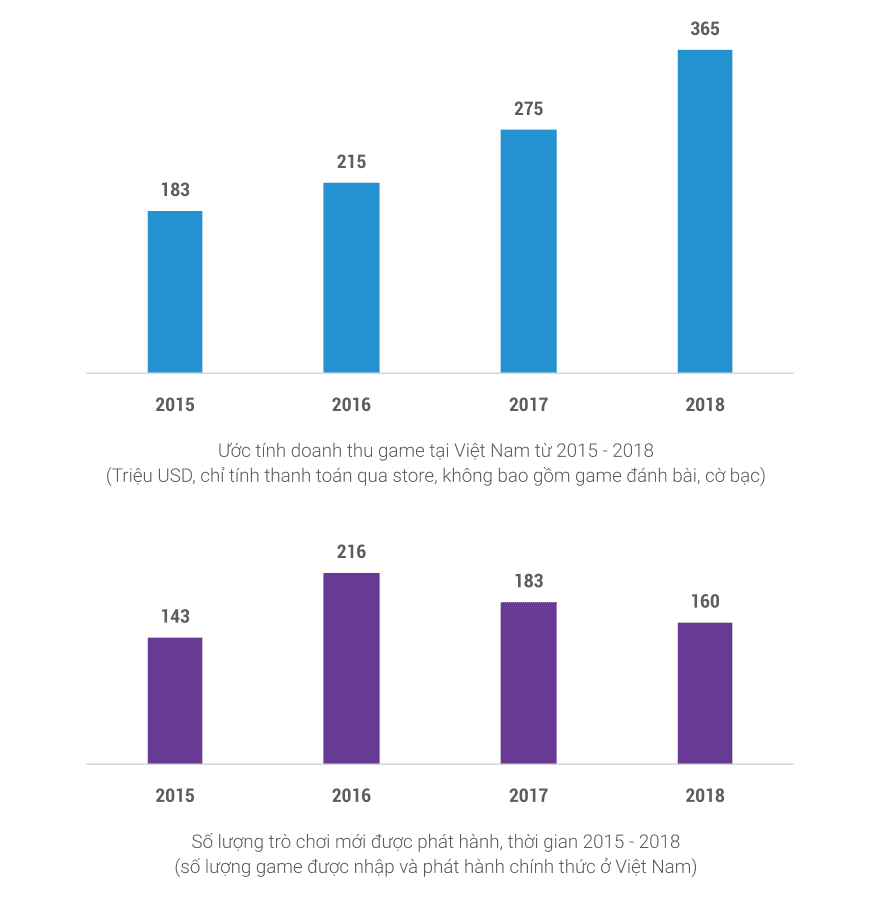
Newzoo and GameK data from 2015–2018 reveals a clear quality-over-quantity pivot. Official app-store game revenue (excluding card and gambling games) nearly doubled from USD 183 million (2015), USD 215 million (2016), and USD 275 million (2017) to USD 365 million in 2018. Meanwhile, newly licensed imported releases fell from a 2016 peak of 216 titles (143 in 2015) to 183 in 2017 and 160 in 2018.
Deeper live operations and stricter licensing mean overseas studios must plan local compliance carefully, as detailed in our guide to mobile game publishing in Vietnam.
Competitive eSports monetization and 402,000 daily livestream watch hours
Accessible competitive titles drove both engagement and spending. Per Garena, Arena of Valor reached 12 million Vietnamese players. App Annie's 2018 combined iOS and Android top-grossing chart was led by Lords Mobile (IGG), Arena of Valor (SEA), The Epoch of Eternity (37games), Rise of the Kings (Onemt), iCá - Bắn Cá Online (VNG), My Country (Jedi Games), Idle Heroes (DH Games), Castle Clash (IGG), Onmyoji (NetEase), and Free Fire (SEA).
Among H1 2018 Top 50 store-grossing titles (App Annie, Appota), eSports topped USD 6 million to lead tracked genres, whereas MMORPGs registered roughly USD 3 million directly on official stores because domestic third-party payment channels process most Vietnamese MMORPG top-ups.
Spectator and livestream growth compounded alongside competitive play according to Appota and Appota Esports:
- eSports players and regular viewers: Rose from 3M / 2M (2016) and 5M / 3.8M (2017) to 15M / 5.2M (2018), projected at 18M players and 8M regular viewers in 2019 (26M total interested).
- H1 2019 non-tournament livestream hours: More than doubled from 10.3M hours (January), 11.2M (February), 14.0M (March), and 16M (April) to 21.5M hours in May 2019.
Non-tournament game livestreams averaged 402,000 watch hours per day in H1 2019, with 61% watched on mobile devices. Further tournament and creator analyses appear in our Gaming insights topic hub.
How did Millennial and Gen Z gamers differ in sessions, livestreaming, and ad tolerance?
Chapter 3 compares over 33 million Millennials (born 1980–1995, Vietnam's core workforce and middle class) with over 14 million Gen Z consumers entering working age within five years (Appota, Kantar, MMA). Appota's survey shows Gen Z playing and streaming more often, yet dismissing ads faster:
| Surveyed Habit (Appota, 2019) | Millennials | Gen Z | Operating Implication |
|---|---|---|---|
| Play mobile games ≥ 5 days/week | 43% | 57% | Gen Z maintains stronger near-daily login habits |
| Play ≥ 2 sessions per gaming day | 45% | 74% | Gen Z splits play into frequent short bursts |
| Spend 60–90 minutes per session | 66% | 57% | Millennials commit to longer uninterrupted sessions |
| Watch livestreams ≥ 3 days/week | 51% | 62% | Streamers reach over three-fifths of Gen Z weekly |
| Watch livestreams on mobile phones | 55% | 64% | Sponsor overlays must stay legible on vertical/small screens |
| Close ads immediately when shown | 48% | 53% | Favor rewarded video and native creator integrations |
The 6–10 PM gaming peak versus the 10 PM–2 AM late-night livestream window
Across six daily time blocks, Millennial gaming stays active throughout the day: 43% (6–10 AM), 50% (10 AM–2 PM), 48% (4–6 PM), peaking at 89% (6–10 PM), then dropping to 20% (10 PM–2 AM). Gen Z starts low at 13% (6–10 AM), rises to 46% (10 AM–2 PM) and 38% (4–6 PM), hits 91% at 6–10 PM, and sustains 32% during 10 PM–2 AM (both cohorts hit 5% at 2–6 AM).
Livestreaming concentrates heavily at night. Daytime concurrency stays at 5–9% for Millennials and 5–14% for Gen Z before 6 PM, then surges at 6–10 PM (58% Millennial, 55% Gen Z) and holds through 10 PM–2 AM (54% Millennial, 55% Gen Z). Because Gen Z deploys ad blockers and rejects pushy sales messaging, native streamer sponsorships outperform interruptive banners.
What technical constraints did Q1 2019 OS, vendor, and screen fragmentation create?
Per StatCounter and Appota, Q1 2019 mobile and tablet OS traffic in Vietnam split across Android (55.10%), iOS (41.62%), Windows (1.85%), and other OSs (1.43%).
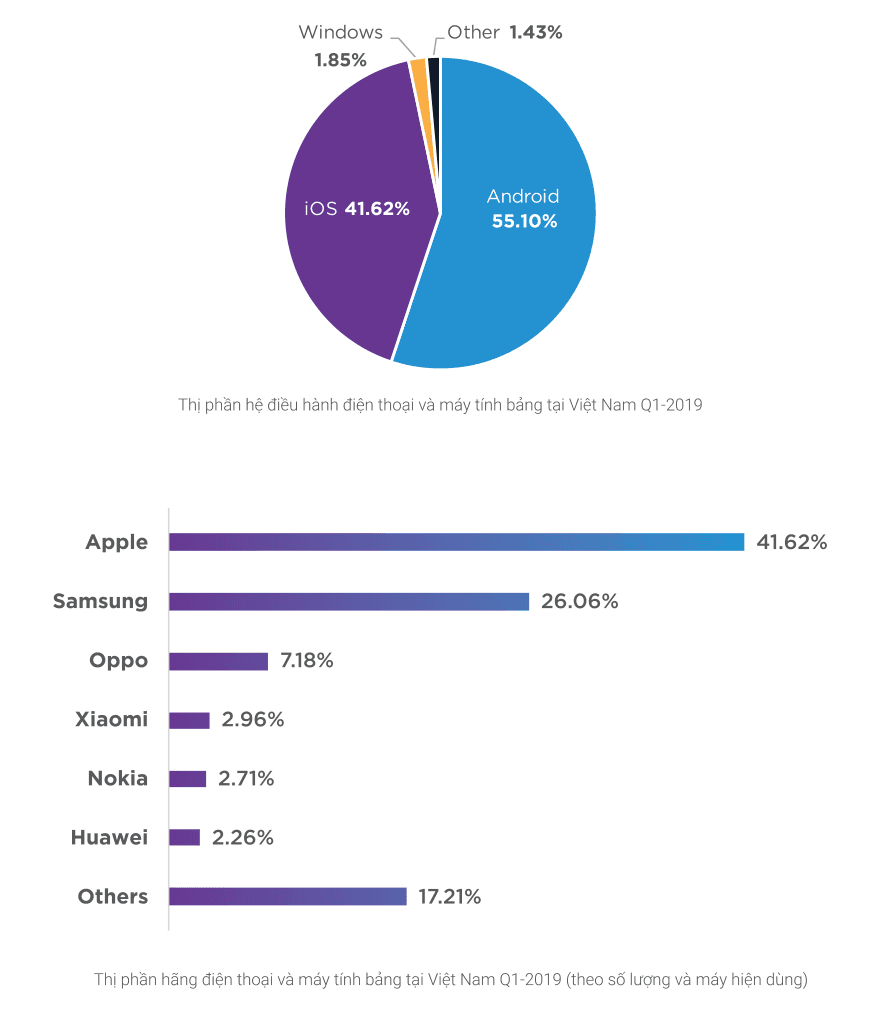
By active device vendor, Apple led all brands at 41.62%, ahead of Samsung (26.06%), Oppo (7.18%), Xiaomi (2.96%), Nokia (2.71%), Huawei (2.26%), and others (17.21%). How active iPhone share continued diverging from new retail sales is tracked in our H1 2020 Vietnam mobile and smartphone market report.
Legacy OS version lag and 360x640 screen resolution persistence
OEM Android customizations and iPhone users deferring updates to avoid hardware slowdowns kept legacy OS versions dominant in Q1 2019:
| Q1 2019 Dimension (StatCounter) | Top Three Active Segments | Remaining Segments | Engineering & QA Constraint |
|---|---|---|---|
| Android Versions | 7.0 Nougat (20.79%), 5.1 Lollipop (18.99%), 6.0 Marshmallow (17.07%) | 4.4 (10.15%), 7.1 (8.14%), 8.0 (7.56%), 8.1 (5.81%), Others (11.49%) | Profile memory carefully for Android 7.0 and below |
| iOS Versions | 10.3 (15.87%), 11.2 (15.01%), 11.4 (12.97%) | 11.3 (11.59%), 12.1 (8.25%), 9.3 (7.72%), 12.0 (4.05%), Others (24.53%) | Retain SDK compatibility across iOS 10–11 |
| Smartphone Screens | 360x640 (22.45%), 375x667 (11.26%), 414x736 (10.80%) | 320x568 (4.85%), 412x732 (3.71%), 412x846 (3.48%), 375x812 (3.13%), 640x360 (2.88%), Other (37.44%) | Scale UI cleanly from 360x640 to tall bezel-less displays |
How did 170% e-wallet growth unlock monetization, and what should teams execute next?
Chapter 5 previews Appota's Vietnam Fintech 2019 benchmarks. In 2018, Vietnam recorded 800 million ATM and POS merchandise transactions worth USD 90.6 billion alongside 170% growth in e-wallet payment value. In Q1 2019, ATM and POS item payments reached 65 million transactions worth USD 7.3 billion (+17.8% YoY) across 261,705 POS terminals, 158 million bank cards, and a 10% cashless transaction share.
Appota's Vietnam Fintech Landscape 2019 spans seven segments: Payment (NAPAS, VNPay, MoMo, ZaloPay, AirPay, GrabPay by Moca, Payoo, ViettelPay…), Financing & Lending (40+ firms), Blockchain & Crypto, Insurtech, Financial Information, Personal Finance, and Banking & Remittance. Five H2 2019 watchpoints included P2P lending competition, mobile banking digitalization, bank model shifts, late-2019 Mobile Money pilots (Viettel, Vinaphone, Mobifone), and e-wallet + P2P lending partnerships.
Four execution priorities for UA managers, game studios, and brand marketers
Decision-makers can translate these five chapters into four immediate actions:
- Pair low-CPI acquisition with local payment rails: Use USD 0.10–0.25 CPI installs for rapid testing, while integrating domestic e-wallets and third-party billing early to capture full LTV.
- Shift forced interstitials into 15–20 second rewarded video: Anchor monetization on rewarded video (51% likeability) near Vietnam's 19-second acceptability threshold.
- Split media dayparts between prime-time play and late-night streams: Bid aggressively for gamers at 6–10 PM (89–91% active) and book mobile-friendly streamer sponsorships from 6 PM to 2 AM for Gen Z.
- Enforce backward compatibility on legacy devices: Test builds and creatives across Android 5.1–7.0, iOS 10–11, and responsive layouts spanning
360x640through tall full-screen phones.
Submit the download form on this page to access the full 44-page Vietnam Mobile Marketing and Game 2019 PDF report, complete Top 50 genre revenue charts, and the high-resolution Vietnam Fintech Landscape 2019 map.
Sources
- Báo cáo Mobile Marketing và Game Việt Nam 2019 (Vietnam Mobile Marketing and Game 2019), Đội nghiên cứu thị trường Công ty Cổ phần Appota (Appota Group), 2019-06-15, accessed 2026-10-31
- Số liệu kinh tế vĩ mô Việt Nam 2010–2018 & Chỉ số niềm tin người tiêu dùng (CCI) 2018, Tổng cục Thống kê Việt Nam (GSO Vietnam) & Kantar Worldpanel / Nielsen, 2019-01-15, accessed 2026-10-31
- Digital 2019: Vietnam — Kết nối Internet, Tốc độ mạng và Thời lượng giải trí trực tuyến, We Are Social & Hootsuite (DataReportal), 2019-01-31, accessed 2026-10-31
- The State of Mobile 2019 — Top Countries by App Downloads & Vietnam Top Apps/Games 2018, App Annie (data.ai) & Garena, 2019-02-28, accessed 2026-10-31
- APAC Mobile App Cost Per Install (CPI) Benchmarks, Chartboost, 2019-03-01, accessed 2026-10-31
- Vietnam Digital & Mobile Advertising Spending (2018–2020) and APAC Mobile Ad Growth, Statista & ExchangeWire / Mobile Marketing Association (MMA), 2019-03-15, accessed 2026-10-31
- Mobile Video & In-App Advertising Receptivity and Daily Mobile Usage in Vietnam, POKKT, Decision Lab & Mobile Marketing Association (MMA), 2019-01-20, accessed 2026-10-31
- Vietnam Mobile Game Revenue & Officially Released Games (2015–2018), Newzoo & GameK, 2019-02-15, accessed 2026-10-31
- Khảo sát hành vi người chơi eSports, Livestream Game H1/2019 và Chân dung Millennial – Gen Z, Appota & Appota Esports ( kết hợp Kantar, MMA), 2019-06-15, accessed 2026-10-31
- Mobile & Tablet Operating System, Vendor & Screen Resolution Market Share Viet Nam (Q1 2018 – Q1 2019), StatCounter Global Stats & Appota, 2019-04-15, accessed 2026-10-31
- Giới thiệu Báo cáo & Bản đồ Hệ sinh thái Vietnam Fintech 2019, Đội nghiên cứu thị trường Appota (dẫn số liệu Ngân hàng Nhà nước & NAPAS), 2019-06-15, accessed 2026-10-31