
Vietnam Mobile Market Report 2015
Appota's Vietnam Mobile Market Report 2015 analyzes device adoption, 3G infrastructure, game publishing, and mobile advertising across Vietnam. Active smartphones reached 34 million (+47.8% YoY) alongside 30 million 3G subscriptions and 22.44 million Android devices (66% share), while 100 new mobile games launched (82% from China), gamer ARPU hit $6, and mobile apps generated 84% of ad impressions.
Comprehensive 2015 Vietnam mobile market analysis: 34M smartphones (+47.8% YoY), 30M 3G subscribers, 22.44M Android devices, 100 new mobile games (82% from China), $6 ARPU, and 84% in-app ad impressions from Appota.
Key findings
- 45M Internet & 55% MobileOut of a total population of 92,660,000 in 2015 (31% urban, 69% rural), Vietnam recorded 45,000,000 Internet users (48% female, 52% male), 36,000,000 active social media users (representing 80% of Internet users), and a 55% mobile Internet user penetration rate (Appota, Google, Facebook).
- 34M smartphones (+47.83% YoY)Vietnamese consumers owned an average of 1.4 screen devices per person as active smartphones jumped from 23,000,000 in 2014 to 34,000,000 in 2015 (+47.83% YoY); 57% of people aged 44 and under used a smartphone, led by the 25–34 age group (63%) and the under-25 cohort (62%) (Appota, Google, Facebook).
- 66% Android (22.44M devices)Android captured 66% of Vietnam's smartphone OS market in 2015 (equating to 22,440,000 Android devices), ahead of iOS (24%), Windows Phone (7%), and other platforms (3%); HD 720x1280 (28.14%) and WVGA 480x800 (23.10%) were the top two Android screen resolutions (Appota).
- 30M 3G subs ($2/85MB)Total 3G subscriptions in Vietnam grew from 22,000,000 in 2014 to 30,000,000 in 2015 (+36.36% YoY) with a benchmark monthly plan of $2 for 85MB; Viettel led with 50% of 3G market share while gamers preferred VinaPhone 3G for connection stability, and 5% of smartphones supported 4G (Vietnam's MIC).
- 28% Casual & 11 AM / 9 PM peakPrime times for downloading new games in Vietnam occurred around 11:00 AM and 9:00 PM (21:00); Casual titles led player preferences at 28%, ahead of Arcade (15%), Action (13%), and Puzzle (13%), while BigKool (817,652 on App Store) and ZingPlay: Tien len (3,442,985 on Google Play) topped 2015 Vietnamese game downloads (Appota, App Annie).
- 100 new games & 82% ChinaVietnam's mobile game publishing market recorded 100 new releases in 2015 out of 170 active titles in the market, led by top publishers Gamota, SohaGame, VNG, VTC Game, VTC Mobile, and Garena; by country of origin, Chinese games accounted for 82%, South Korea 10%, Vietnam 3%, and others 5% (Appota, Google Report).
- 3h/day, $6 ARPU & 11% retentionAmong Vietnamese mobile gamers in 2015, 92% were male (8% female), 36% were aged 16–24, 30% aged 25–30, and 53% were well-educated (40% students); gamers played an average of 3 hours per day across 2.5 daily logins (peaking between 7:00 PM and 1:00 AM), generating $6 ARPU and an 11% retention rate (Appota, Google Report).
- 84% In-App Ads & $0.3–$1 CPISmartphones generated 86.2% of Vietnam's 2015 mobile ad impressions (tablets 13%, feature phones 0.8%), Android delivered 54.9% (iOS 30.7%, Windows Phone 13.2%), and mobile apps captured 84% versus 16% on mobile websites; ad pricing stood at $0.01–$0.03 CPC, $0.30–$0.40 incentive CPI, $0.50–$1.00 non-incentive CPI, and $1–$2 CPM (Appota, Google Report).
How Did 10 Industry Milestones and a 13-Segment Ecosystem Shape the Vietnam Mobile Market in 2015?
Published on January 8, 2016 by Appota Joint Stock Company, the Vietnam Mobile Market Report 2015 synthesizes a pivotal year of hardware expansion, 3G connectivity, game publishing, and mobile advertising across Vietnam. The 17-slide study combines operational telemetry from Appota's ecosystem (Adsota, AppDaily, onClan, Appota, Gamehub.vn, Gamota, and AppotaPay) with benchmark datasets from Google, Facebook, Vietnam's Ministry of Information and Communications (Vietnam's MIC), and App Annie.
Readers following our Gaming research can compare this full-year review against the Vietnam Mobile Market and Mobile Game Report Q1 2014 to see how smartphone adoption accelerated between 2014 and 2015. The opening section (slides 2–4) outlines Appota's platform capabilities, chronicles the Top 10 industry milestones of 2015, and maps the domestic mobile landscape.
Top 10 Milestones Across the Vietnam Mobile Market From May to December 2015
On slide 3 (Vietnamese Mobile 2015 Top 10 Milestone), Appota highlights 10 defining events between May and December 2015 across hardware, developer tools, telecoms, and gaming:
| Month (2015) | Milestone Printed on Slide 3 | Strategic Impact on the Vietnam Mobile Market |
|---|---|---|
May (MAY) |
Bkav unveiled Bphone | Domestic technology group Bkav unveiled the first-generation Bphone smartphone designed and manufactured in Vietnam |
June (JUN) |
Apple introduced Swift | Apple unveiled Swift 2 and open-source plans at WWDC, accelerating iOS developer adoption in Vietnam |
July (JUL) |
The GMGC was brought to Vietnam | The Global Mobile Game Confederation (GMGC) hosted its conference in Vietnam for the first time |
August (AUG) |
Vietnam's deputy prime minister Vu Duc Dam meets with the leaders of Vietnamese startups | Deputy Prime Minister Vu Duc Dam met with Vietnamese tech startup founders, strengthening policy support |
September (SEP) |
Apple presented the new generation | Apple introduced iPhone 6s, iPhone 6s Plus, and iPad Pro, driving year-end hardware upgrades |
September (SEP) |
3 Big Telecoms in Vietnam had already launched on their own OTT | Vietnam's three largest mobile carriers (Viettel, MobiFone, and VinaPhone) launched their own OTT messaging apps |
September (SEP) |
S-Game shut down | Domestic game studio and publisher S-Game ceased operations amid fierce competition from imported games |
September (SEP) |
Bluebird Award started broadcasting on VTV | The Bluebird Award mobile game programming competition began broadcasting on Vietnam Television (VTV) |
October (OCT) |
Apple officially opened company in Vietnam | Apple officially established its local subsidiary in Vietnam (Apple Vietnam LLC) |
December (DEC) |
Viettel pioneered in 4G service testing | Telecom group Viettel pioneered commercial 4G LTE field testing in Vietnam (starting in Ba Ria – Vung Tau) |
These 10 milestones reflect three structural shifts: direct market entry by global tech leaders (Apple, GMGC), digital service expansion by domestic telecom operators (carrier OTT apps and 4G trials), and market consolidation in gaming (S-Game) balanced by televised indie developer incubation (Bluebird Award).
Mapping the 13 Functional Segments of the Vietnamese Mobile Market Landscape 2015
On slides 2 and 4 (Vietnamese Mobile Market Landscape 2015), Appota maps the companies, platforms, and investment funds operating in Vietnam across 13 distinct categories.
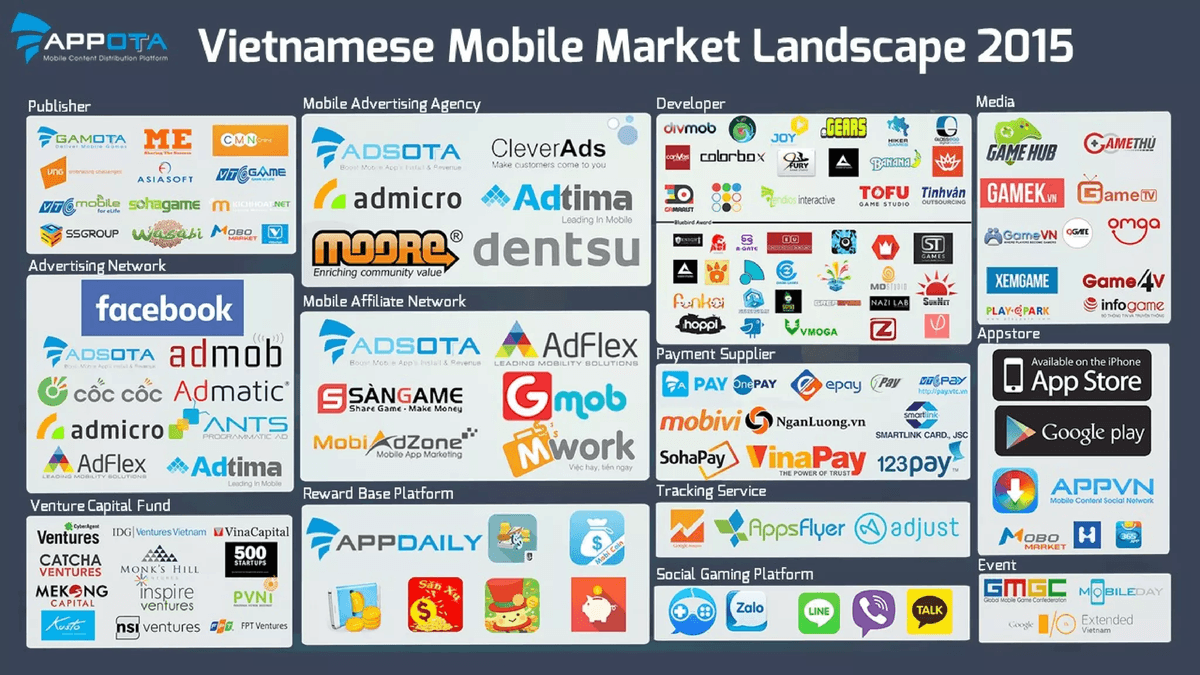
The landscape diagram on slide 4 shows a complete domestic mobile value chain:
- Publishers (Publisher): Thirteen active publishers: Gamota, ME Corp, CMN Online, VNG, Asiasoft, VTC Game, VTC Mobile, SohaGame, KichHoat.net, SSGroup, Wasabi, Mobo Market, and VGP.
- Developers (Developer): The upper tier lists 15 commercial and outsourcing studios (Divmob, Pine Entertainment, Joy Entertainment, .GEARS, Hiker Games, GlassEgg Digital Media, ColorBox, Fury Game Studio, Banana, Goyoo, C.Marist, Senspark, Endios Interactive, Tofu Game Studio, and Tinhvan Outsourcing). The lower tier features 22 indie studios from the Bluebird Award (such as ABI, B-Gate, ST Games, Fenikci, MD Studio, Sunnet, Hoppi, VMOGA, and Nazi Lab).
- Advertising Networks & Mobile Advertising Agencies: Ad networks include Facebook, Adsota, AdMob, Cốc Cốc, Admatic, Admicro, ANTS, AdFlex, and Adtima. Agencies comprise Adsota, CleverAds, Admicro, Adtima, Moore, and Dentsu.
- Mobile Affiliate Networks & Reward-Based Platforms: Affiliate networks include Adsota, AdFlex, SànGame, Gmob, MobiAdZone, and Mwork, alongside reward platforms AppDaily, Mobi Coin, and Săn Xu.
- Payment Suppliers & Tracking Services: Billing spans 11 providers (AppotaPay, OnePAY, EPAY, 1Pay, VTC Pay, Mobivi, NganLuong.vn, Smartlink, SohaPay, VinaPay, and 123Pay), paired with Google Analytics, AppsFlyer, and Adjust.
- App Stores, Social Gaming Platforms, Media & Events: Alongside App Store and Google Play, four third-party stores (Appvn, Mobo Market, HipStore, 365 App), five social platforms (onClan, Zalo, LINE, Viber, KakaoTalk), 11 media outlets (GameHub.vn, Gamethủ, GameK.vn, GameTV, GameVN, QGate, Omga, XemGame, Game4V, PlayPark, InfoGame), and three major events (GMGC, Vietnam Mobile Day, Google I/O Extended Vietnam) supported distribution.
- Venture Capital Funds: Twelve active funds: CyberAgent Ventures, IDG Ventures Vietnam, VinaCapital, Catcha Ventures, Monk's Hill Ventures, 500 Startups, Mekong Capital, Inspire Ventures, PVNI, Kusto, NSI Ventures, and FPT Ventures.
How Fast Did Smartphone Penetration, Android Hardware, and 3G Subscriptions Grow in 2015?
Chapters 2 and 3 (slides 5–9) synthesize data from Appota, Google, Facebook, and Vietnam's Ministry of Information and Communications (Vietnam's MIC) to quantify Internet penetration, smartphone growth, Android screen resolutions, and 3G/4G adoption.
92.66 Million Population, 45 Million Internet Users, and 55% Mobile Internet Penetration
According to slide 5 (Vietnamese Mobile Users Behavior), Vietnam's population stood at 92,660,000 in 2015, split between 31% urban and 69% rural residents:
- 45,000,000 Internet users: Representing 48.56% of the national population, with 52% male and 48% female users.
- 36,000,000 active social media users: Accounting for 80% of Internet users (
36,000,000 / 45,000,000 = 80%). - 55% mobile Internet user penetration: More than half of connected users accessed the web via mobile devices.
Active Smartphones Jump 47.83% to 34 Million as Multi-Screen Ownership Hits 1.4 Devices per Person
Slide 6 (Vietnamese Mobile Users Behavior, sourced from Appota, Google, and Facebook) shows that Vietnamese users owned an average of 1.4 devices per person.
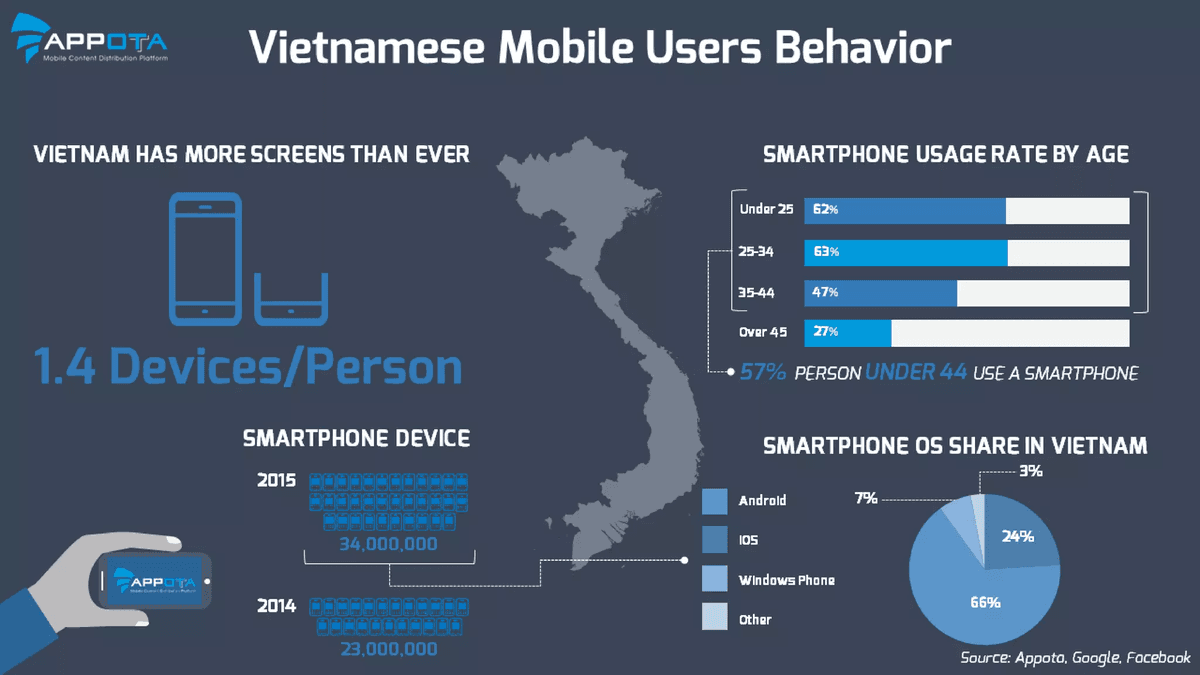
Active smartphones in Vietnam (Smartphone Device) grew by 11,000,000 units in a single year, rising from 23,000,000 in 2014 to 34,000,000 in 2015 (+47.83% YoY). By age group (Smartphone Usage Rate By Age), young adults led adoption:
- Ages 25–34: Reached the highest smartphone usage rate at 63%.
- Under 25: Followed at 62%.
- Ages 35–44: Reached 47%.
- Over 45: Recorded 27%.
Across the three cohorts under age 44, 57% of people aged 44 and under used a smartphone. By operating system (Smartphone OS Share in Vietnam), Android led with 66% share, iOS held 24%, Windows Phone captured 7%, and Other OS platforms accounted for 3%.
22.44 Million Android Devices by Screen Resolution and 9 Daily Mobile Activities
On slide 7 (Android Smartphone Behavior By Screen Resolution, sourced from Appota), Vietnam recorded 22,440,000 active Android devices (34,000,000 × 66% = 22,440,000). HD (720x1280) ranked first at 28.14%, overtaking WVGA (480x800) at 23.10%.
| Device & Activity Benchmark (Slides 6–8) | Segment / Metric | 2015 Share / Volume | Operational Context |
|---|---|---|---|
| Active smartphones (slide 6) | Total market / Android base | 34,000,000 / 22,440,000 units | Up 47.83% YoY from 23,000,000 smartphones in 2014 |
| Smartphone OS share (slide 6) | Android / iOS / Windows Phone / Other | 66% / 24% / 7% / 3% | Android and iOS together account for 90% of smartphones |
| Android resolutions (slide 7) | HD (720x1280) / WVGA (480x800) | 28.14% / 23.10% | Top two resolutions represent 51.24% of Android devices |
| Android resolutions (slide 7) | FHD (1080x1920) / FHD (1080x1776) | 12.99% / 8.19% | Combined Full HD viewports account for 21.18% of Android devices |
| Android resolutions (slide 7) | qHD (540x960) / FWVGA (480x854) | 7.96% / 7.16% | Top 6 resolutions cover 87.54% (leaving 12.46% other) |
| Daily activities (slide 8) | Take Photos & Videos / Listen to Music / Play Games | 71% / 70% / 58% | Multimedia and gaming lead daily smartphone engagement |
| Daily activities (slide 8) | Check News / Read Books & Magazines / Maps & Traffic | 54% / 50% / 42% | Core daily reading and navigation utilities |
| Daily activities (slide 8) | Manage Diary / Check Weather / Track Health | 36% / 33% / 10% | Personal organization and fitness tracking |
On slide 8 (Daily Mobile Activities, sourced from Google Report), Take Photos / Videos led daily behaviors at 71%, followed by Listen To Music (70%), Play Games (58%), Check News (54%), and Read Books / Magazines (50%). Utility habits included Access travel/traffic/Maps (42%), Manage Diary (36%), Check Weather (33%), and Track Health / Activity Level (10%).
30 Million 3G Subscriptions, $2/85MB Monthly Plans, and Carrier Stability for Gamers
On slide 9 (Vietnam 3G Usage), data from Vietnam's MIC shows 3G subscriptions rising from 22,000,000 in 2014 to 30,000,000 in 2015 (+36.36% YoY). A standard monthly 3G plan cost $2 for 85MB ($2/85MB).
The top four 3G activities (Top Activity) were News (87%), Search (84%), OTT messaging (74%), and Social networking (63%). Slide 9 highlights three carrier findings:
- Viettel leads with 50% of 3G market share: Nationwide coverage gave Viettel half of all 3G subscriptions in Vietnam.
- Gamers prefer VinaPhone 3G data: Mobile gamers favored VinaPhone 3G packages because they offered a more stable connection for online games than Viettel.
- Early 4G trials with 5% smartphone readiness: As carriers launched limited 4G trials in late 2015, 5% of smartphones in Vietnam were able to use 4G.
What Defined Mobile Gaming in the Vietnam Mobile Market During 2015?
Chapter 4 (slides 10–13) combines telemetry from Appota, App Annie, and Google Report to analyze download prime times, genre preferences, top domestic titles, game publishing origins, and gamer monetization.
11:00 AM and 9:00 PM Download Peaks Alongside a 28% Casual Genre Share
On slide 10 (Which Kind Of Game Played In 2015?), the 24-hour curve Time for downloading a new Game maps hourly installation volume against the daily Average line.
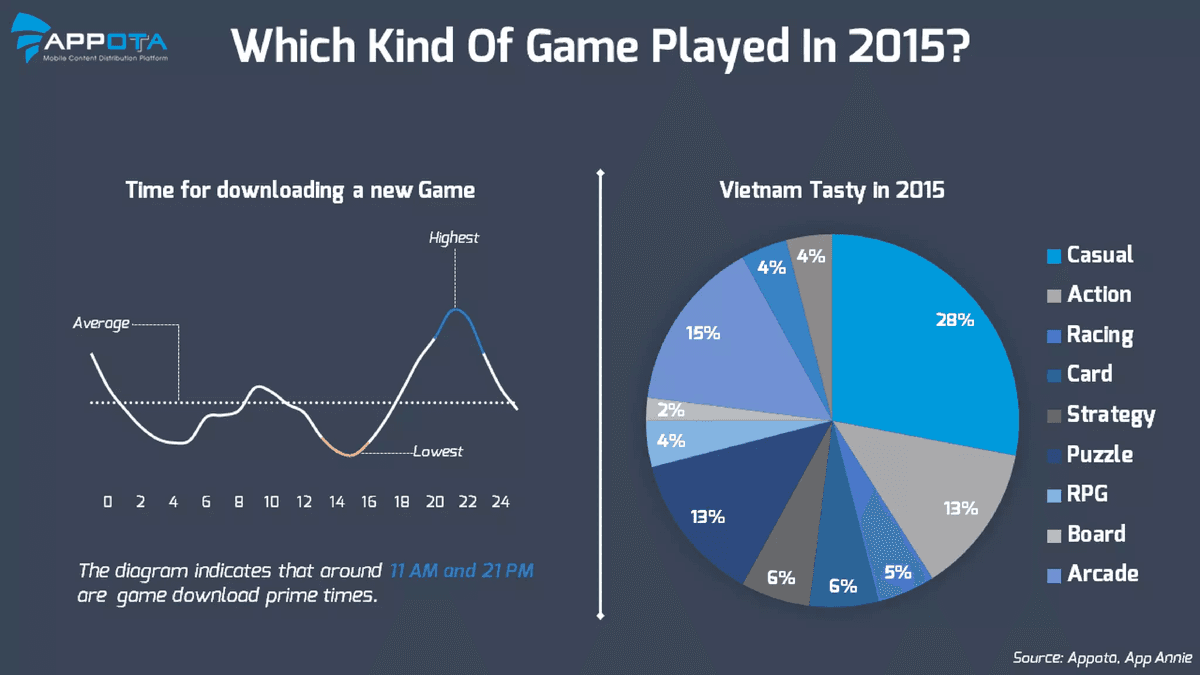
The curve identifies two daily prime times for downloading new games: around 11:00 AM and 9:00 PM (printed as 11 AM and 21 PM), with the daily trough (Lowest) occurring between 2:00 PM and 3:00 PM (14:00–15:00).
On the right half of slide 10, the pie chart Vietnam Tasty in 2015 (Appota, App Annie) breaks down genre preferences:
- Mass-market genres capture 69%: Casual led at 28%, followed by Arcade (15%), Action (13%), and Puzzle (13%).
- Mid-core and card genres: Card and Strategy each held 6%, Racing captured 5%, RPG held 4%, and Board accounted for 2% (alongside two unlabeled 4% slices completing 100%).
Top 5 Downloaded Vietnamese Games on the App Store and Google Play in 2015
On slide 11 (Vietnamese Games On Ranking In 2015), App Annie full-year download rankings list the top five Vietnamese-developed games on the App Store and Google Play.
| Rank | Top Vietnamese Games on App Store (iOS) | 2015 iOS Downloads | Top Vietnamese Games on Google Play (Android) | 2015 Android Downloads |
|---|---|---|---|---|
| 1 | BigKool | 817,652 | ZingPlay: Tien len (ZingPlay: Tiến lên) | 3,442,985 |
| 2 | ZingPlay: Tien len (ZingPlay: Tiến lên) | 684,729 | Tien len - Southern Poker (Tiến lên Miền Nam) | 3,017,039 |
| 3 | BigOne | 637,614 | iWin | 2,010,127 |
| 4 | Bắn cá 2015 | 505,005 | Ai là triệu phú 2016 | 1,883,568 |
| 5 | Ai là triệu phú 2016 | 503,316 | Tá lả - Phỏm – Zing Play | 1,635,133 |
| Top 5 Total | Top 5 App Store Titles Combined | 3,148,316 | Top 5 Google Play Titles Combined | 11,988,852 |
Three patterns stand out from App Annie's leaderboard on slide 11:
- Google Play Top 5 volume is 3.81× larger than App Store Top 5: The top five Vietnamese games on Google Play generated 11,988,852 downloads, compared with 3,148,316 downloads on iOS.
- Two cross-platform hits chart on both stores: ZingPlay: Tien len (4,127,714 combined installs) and Ai là triệu phú 2016 (2,386,884 combined installs) ranked in the Top 5 on both platforms.
- Social card portals and casual arcade/trivia lead domestic downloads: Seven of the 10 slots belonged to traditional card and board portals (BigKool, ZingPlay: Tien len, BigOne, Tien len - Southern Poker, iWin, and Tá lả - Phỏm), joined by Bắn cá 2015 and Ai là triệu phú 2016.
100 New Games Published in 2015 as Chinese Titles Capture 82% Market Share
On slide 12 (Mobile Game Publishing in Vietnam 2015, sourced from Appota and Google Report), Vietnam recorded 100 new mobile games in 2015 out of 170 total games active in the market (new releases represented 58.82% of active titles).
Six top publishers led the market: Gamota, SohaGame, VNG, VTC Game, VTC Mobile, and Garena. By country of origin (China dominated Vietnam mobile Game market):
- China: Accounted for 82% of published mobile games in Vietnam.
- South Korea: Ranked second at 10%.
- Other countries: Accounted for 5%.
- Vietnam: Domestic commercial releases accounted for 3%.
Teams planning mobile game publishing in Vietnam can compare these 2015 origin figures against modern licensing and localization standards.
Vietnamese Mobile Gamer Profile: 92% Male, 3 Hours Daily Playtime, $6 ARPU, and 11% Retention
Slide 13 (Vietnamese Mobile Gamers Behavior, sourced from Appota and Google Report) details the demographics and monetization metrics of Vietnamese mobile gamers:
| Gamer Benchmark (Slide 13) | Cohort / Metric | 2015 Value | Strategic Meaning for Publishers |
|---|---|---|---|
| Age distribution (Age) | Ages 16–24 / Ages 25–30 / Under 18 | 36% / 30% / 21% | Players aged 30 and under represent 87% of the gaming audience |
| Gender split (Genre / Gender) | Male / Female | 92% / 8% | Core 2015 mobile gaming audience skewed heavily male |
| Education level (Education) | Well-educated / Student | 53% / 40% | 93% of gamers are students or college-educated working adults |
| Peak play windows (Most played time) | Early evening / Late evening / Late night | 7–8 PM / 9–11 PM / 11 PM–1 AM | Live-ops events should target the 7:00 PM to 1:00 AM window |
| Session engagement | Average playing time / Average daily logins | 3 hours/day / 2.5 times/day | High daily engagement averaging over 70 minutes per session |
| Monetization & Retention | Average Revenue Per User (ARPU) / Retention rate | $6 / 11% | Solid $6 ARPU paired with steep early-stage player churn |
Working-age players aged 25–30 (30%) and well-educated users (53%) supported Vietnam's $6 ARPU. Gamers averaged 3 hours of playtime per day across 2.5 logins, peaking between 7:00 PM and 1:00 AM. Meanwhile, the 11% retention rate highlighted the importance of onboarding and community features—trends further examined in the Vietnam Mobile Game Market Report 2024.
How Did Mobile Advertising Perform in Vietnam in 2015 Across Impressions, CTR, and CPI/CPM Pricing?
The final section (slides 14–16, sourced from Appota and Google Report) establishes 2015 benchmarks for mobile ad impressions, post-ad user actions, CTR performance, and media buying costs.
86.2% Smartphone Impressions, 54.9% on Android, and 84% Inside Mobile Apps
On slide 14 (State Of Mobile Ads In Vietnam 2015), mobile ad impressions are segmented by device, OS, and delivery channel.
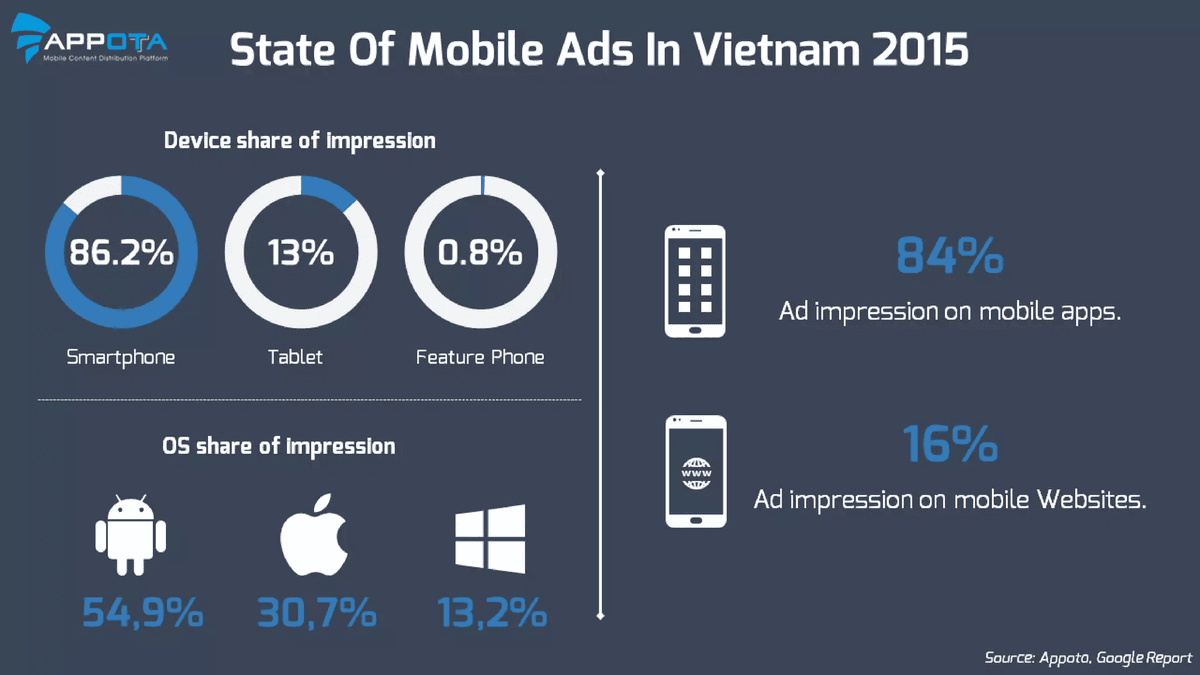
In-app inventory on smartphones dominated domestic mobile ad delivery:
- By device (Device share of Impression): Smartphones generated 86.2% of impressions, Tablets accounted for 13%, and Feature Phones held 0.8%.
- By OS (OS share of impression): Android led with 54.9%, iOS delivered 30.7%, and Windows Phone captured 13.2% (leaving 1.2% other). Both iOS and Windows Phone over-indexed on ad impressions relative to their device share (24% and 7%).
- By channel (In-App vs. Mobile Web): 84% of ad impressions occurred inside mobile apps, outpacing the 16% on mobile websites by 5.25×.
Consumer Post-Ad Actions and Top-Performing Ad Formats by Click-Through Rate
Slide 15 tracks four consumer actions driven by mobile content and advertising:
- Download mobile content: Performed by 57% of users.
- Find a good deal on something: Performed by 46% of users.
- Learn about brand: Performed by 44% of users.
- Locate something nearby: Performed by 33% of users.
Ranked by click-through rate (Top performing mobile apps ad-types by Click-through-rate), the top five formats from highest to lowest CTR were Search ads, Social ads, Banner ads in apps, Banner ads in website, and Rich media–video ads.
2015 Vietnam Mobile Ad Pricing Benchmarks: CPC, Incentive/Non-Incentive CPI, and CPM
On slide 16 (State of mobile Ads in Vietnam 2015), Appota and Google Report publish unit cost ranges across four pricing models:
| Pricing Model (Slide 16) | Campaign Type | 2015 Unit Cost (USD) | Primary Use Case in Vietnam |
|---|---|---|---|
| CPC (Cost per click) | Performance traffic acquisition | $0.01 – $0.03 | Cost-efficient traffic generation and creative testing |
| CPI (Cost per install) — Incentive | Rewarded app installation | $0.30 – $0.40 | Rapid store ranking campaigns via platforms like AppDaily |
| CPI (Cost per install) — Non-Incentive | Non-rewarded organic/targeted install | $0.50 – $1.00 | Acquiring high-intent users to lift 11% retention and $6 ARPU |
| CPM (Cost per mille) | Cost per 1,000 impressions | $1.00 – $2.00 | Brand awareness across Vietnam's 84% in-app display inventory |
Slide 17 concludes with contact details for Appota's four vertical leads—Mr. Dang Thai Son (Mobile Market), Mr. Nguyen Duy Hien (Advertising Mobile Market), Mr. Tran Vinh Quang (Gaming Mobile Market), and Mr. Dao Tuan Anh (Payment Market)—and offices in Hanoi, Ho Chi Minh City, Jakarta, and Singapore.
Four Actionable Takeaways From the Vietnam Mobile Market Report 2015
Appota's 2015 dataset points to four operational priorities for mobile teams:
- Optimize Android UI Layouts for HD (720x1280) and WVGA (480x800) Viewports First: With 22,440,000 Android devices (66% OS share) and HD (28.14%) plus WVGA (23.10%) representing over half of Android screens, QA teams should prioritize these viewports alongside Full HD (21.18%).
- Keep Initial Packages Lean for $2/85MB 3G Plans and Test on Both Viettel and VinaPhone: Because monthly 3G plans provide 85MB for $2, Viettel holds 50% 3G share, and gamers favor VinaPhone 3G for stability, studios should compress initial installers and optimize routing on both carriers.
- Schedule UA Bursts for 11:00 AM and 9:00 PM While Balancing Incentive and Non-Incentive CPI: Downloads peak at 11:00 AM and 9:00 PM while gameplay spans 7:00 PM to 1:00 AM (3 hours/day, 2.5 logins). Pairing Incentive CPI ($0.30–$0.40) with Non-Incentive CPI ($0.50–$1.00) helps improve the 11% retention rate and capture Vietnam's $6 ARPU.
- Prioritize In-App Inventory (84%) Combined With Search and Social Formats: Because 84% of mobile ad impressions occur inside apps and 57% of users download mobile content, marketers should combine in-app banners and $1–$2 CPM reach with high-CTR Search ads and Social ads.
Sources
- Vietnam Mobile Market Report 2015 (Vietnam Mobile Report 2015), Công ty Cổ phần Appota (Appota Group), 2016-01-08, accessed 2026-11-02
- Consumer Barometer & Vietnam Mobile User / Gamer / Advertising Behavior Reports (2015), Google & Facebook (dẫn qua báo cáo Appota), 2015-12-01, accessed 2026-11-02
- Thống kê thuê bao 3G, thị phần nhà mạng và thử nghiệm 4G tại Việt Nam năm 2015, Bộ Thông tin và Truyền thông Việt Nam (Vietnam's MIC), 2015-12-25, accessed 2026-11-02
- Vietnam Mobile Game Genre Breakdown & Top Downloaded Vietnamese Games Ranking 2015, App Annie (nay là data.ai / Sensor Tower) & Appota, 2015-12-31, accessed 2026-11-02
- Hệ thống đo lường thiết bị, phát hành game và mạng quảng cáo di động Appota (Adsota, Gamota, AppotaPay, onClan, AppDaily, Gamehub.vn) năm 2015, Công ty Cổ phần Appota (Appota Group), 2016-01-08, accessed 2026-11-02