
Vietnam Mobile Market and Mobile Game Report Q1 2014
Appota's Vietnam mobile market report for Q1 2014 analyzes global operating system shares, domestic device fragmentation, and app store rankings. Android captured 78% of global smartphone sales, while in Vietnam iOS 7.0.4 reached 32.3%, Android Jelly Bean held 61.2%, and local indie games surged following the global Flappy Bird phenomenon.
Analysis of iOS 7.0.4 (32.3%) and Android Jelly Bean (61.2%) adoption, screen resolutions, the post-Flappy Bird wave, Top 5 store charts, and Appota's Q1 2014 distribution data.
Key findings
- 78% and 65.0%–68%Android accounted for 78% of worldwide smartphone sales to end users (ahead of iOS at 16%, Windows Phone at 3%, BlackBerry at 2%, and Other at 1%); Samsung represented 65.0% on the Android manufacturer pie chart and 68% in the accompanying slide callout (Localytics, Gartner).
- 61% vs 39% revenueGlobal app store revenue split between Apple App Store (61%) and Google Play (39%) in February 2014; across the six-month window from September 2013 (65% vs 35%) to February 2014, App Store revenue share declined by 4 percentage points and slipped 1 percentage point from January 2014 (Distimo).
- 74% universal appsShare of global developers building universal apps that run across both smartphones and tablets; by content category, Games led developer focus at roughly 24%–25%, followed by Productivity and tools (~17%–17.5%) and Music & Entertainment (~13%–13.5%) (Millennial Media).
- 32.3% iOS 7.0.4 & 70.82% iPhoneIn Vietnam, iOS 7.0.4 jumped from 4.9% (Q4 2013) to 32.3% (Q1 2014) to overtake iOS 6.1.x (down from 49.4% to 29.4%), while iOS 7.1 captured 7.7% within less than a month of launch; iPhones accounted for 70.82% of active iOS devices (iPhone 5 at 19.5%, up 4.5%) and 320x480 screens generated 53.5% of iOS web browsing (Appota).
- 61.2% Jelly Bean & 36.6% 480x800Android Jelly Bean rose from 41.3% (Q4 2013) to 61.2% in Vietnam during Q1 2014 (comprising 4.1.x at 32.7%, 4.2.x at 16.3%, and 4.3 at 12.2%), whereas Android 4.4 KitKat reached only 4.6%; 480x800 resolution led Android web browsing at 36.6% and all four top devices by ad impression belonged to Samsung (Galaxy S3, Note 2, S2, S4) (Appota).
- Top 5 Free & GrossingFacebook, Zalo, Zing MP3, and Camera360 Ultimate dominated the Top 5 Free Downloaded charts on both Apple App Store and Google Play in Vietnam (joined by Facebook Messenger on iOS and Viber on Android), while Supercell's Clash of Clans ranked first on both Top Grossing charts alongside Hay Day (Distimo).
- 52 top apps & 1M+ fansAppota's distribution platform recorded 29 top-downloaded iOS titles and 23 top-downloaded Android titles in Q1 2014, while launching the Gamehub.vn mobile gaming portal and a March–June 2014 developer support program reaching over 1,000,000 Facebook fans, 20+ forums, and 50,000+ YouTube subscribers (Appota).
How Did Global OS and App Store Shifts Shape the Vietnam Mobile Market in Q1 2014?
Published on April 9, 2014 by the Appota Editors Team, the Q1 2014 Vietnam mobile market report (Mobile Market Report Quarter I - 2014) captures device adoption, operating system fragmentation, and store monetization immediately following the global breakout of Flappy Bird. The 21-slide study benchmarks international datasets from Localytics, Gartner, Distimo, and Millennial Media against primary telemetry from Appota's domestic distribution and advertising network. Readers exploring our Gaming coverage can compare these early benchmarks with the decade-later landscape in the Vietnam Mobile Game Market Report 2024.
The opening chapter of the report (slides 4–6) establishes global reference metrics across smartphone operating system sales, Android hardware manufacturer concentration, revenue dynamics between the two dominant app stores, and developer production priorities.
Android Captures 78% of Global Smartphone Sales as Samsung Leads Hardware Usage
According to Localytics and Gartner data cited on slide 4, Android accounted for 78% of worldwide smartphone sales to end users in Q1 2014. Apple's iOS ranked second with 16% of global device sales. The remaining three segments represented a combined 6% of the market, comprising Windows Phone at 3%, BlackBerry at 2%, and other operating systems at 1%.
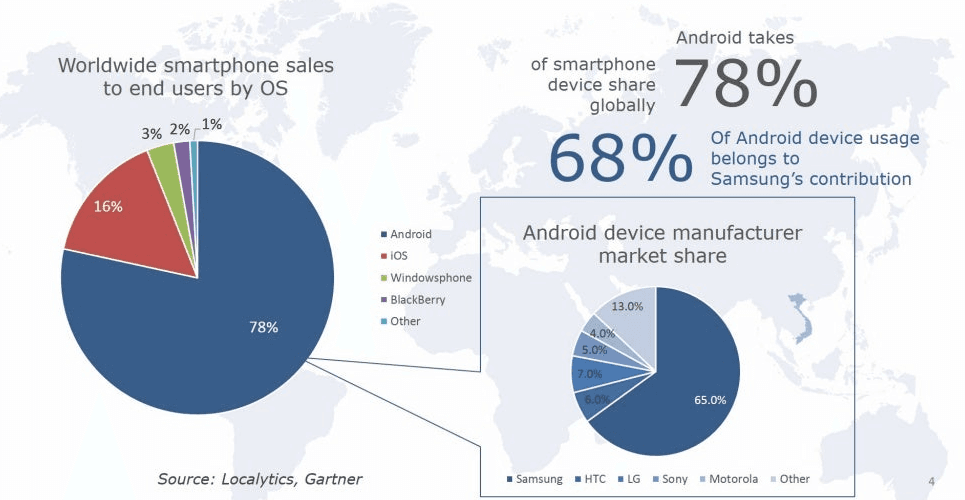
Within the global Android ecosystem, Samsung's Galaxy lineup maintained a commanding lead in active device usage. The callout box on slide 4 notes that 68% of Android device usage belonged to Samsung's contribution, while the detailed six-slice pie chart on the right records Samsung's exact share at 65.0%. The gap between Samsung and competing Android OEMs is summarized in the table below.
| Global Benchmark Metric (Q1 2014) | OS / Manufacturer | Reported Share | Slide Source |
|---|---|---|---|
| Worldwide smartphone sales to end users | Android | 78% | Localytics, Gartner (slide 4) |
| Worldwide smartphone sales to end users | iOS | 16% | Localytics, Gartner (slide 4) |
| Worldwide smartphone sales to end users | Windows Phone | 3% | Localytics, Gartner (slide 4) |
| Worldwide smartphone sales to end users | BlackBerry | 2% | Localytics, Gartner (slide 4) |
| Worldwide smartphone sales to end users | Other operating systems | 1% | Localytics, Gartner (slide 4) |
| Android device manufacturer usage share | Samsung | 65.0% (callout states 68%) | Localytics, Gartner (slide 4) |
| Android device manufacturer usage share | LG | 7.0% | Localytics, Gartner (slide 4) |
| Android device manufacturer usage share | HTC | 6.0% | Localytics, Gartner (slide 4) |
| Android device manufacturer usage share | Sony | 5.0% | Localytics, Gartner (slide 4) |
| Android device manufacturer usage share | Motorola | 4.0% | Localytics, Gartner (slide 4) |
| Android device manufacturer usage share | Other manufacturers | 13.0% | Localytics, Gartner (slide 4) |
Behind Samsung, the next four manufacturers were LG (7.0%), HTC (6.0%), Sony (5.0%), and Motorola (4.0%), with all other OEMs combined at 13.0%. This international hardware concentration directly mirrored active device usage in Vietnam, where all four top Android smartphones by ad impression volume belonged to Samsung's Galaxy S and Galaxy Note series.
Global Revenue Share Shifts Between Apple App Store and Google Play
Although Android generated 78% of handset unit sales, the Apple App Store retained a clear lead in global developer monetization. Distimo's six-month tracking series on slide 5 compares global revenue and download share between the Apple App Store and Google Play from September 2013 (T.9) through February 2014 (T.2).
In September 2013, the Apple App Store generated 65% of global app store revenue compared with 35% for Google Play. By January 2014 (T.1), that split narrowed to 62% on the App Store versus 38% on Google Play. In February 2014 (T.2, the closing month of the Q1 2014 series), Apple App Store held 61% of global revenue while Google Play expanded to 39%. Across the full six-month window from September 2013 to February 2014, Apple App Store ceded 4 percentage points of global revenue share to Google Play, including a 1-percentage-point shift between January and February 2014.
Developer Category Focus and 74% Universal App Adoption
On the supply side, Millennial Media's developer survey on slide 6 highlights two structural production trends in Q1 2014. First, 74% of mobile developers worldwide built universal applications designed to run seamlessly across both smartphones and tablets. Only 26% restricted their builds to a single form factor.
Second, on the horizontal bar chart measuring developer participation by content category (scaled in 5% increments from 0% to 25%), Games ranked first at approximately 24%–25%. Productivity and tool applications placed second at roughly 17%–17.5%, followed by Music & Entertainment in third place at around 13%–13.5%. Subsequent categories included Social Networking (9.5%), News (9.5%), Travel (7.5%), Communication (6.5%), Sports (6.5%), and Weather (3%).
How Were iOS and Android Devices Fragmented in the Vietnam Mobile Market?
Chapter 2 of the report (slides 7–12) examines primary telemetry collected across Appota's domestic network in Vietnam. The data contrasts rapid operating system upgrades on Apple devices against persistent version and screen-size fragmentation across Android handsets.
Rapid Adoption of iOS 7.0.4 and iOS 7.1 alongside iPhone and iPad Screen Splits
A quarter-over-quarter comparison between Q4 2013 and Q1 2014 on slide 7 illustrates a swift transition from iOS 6 to iOS 7 in Vietnam. In Q4 2013, iOS 6.1.x dominated nearly half of all domestic Apple devices at 49.4% (rounded to 50% in the slide text), accompanied by iOS 6.0.x at 10.7% and legacy iOS 5.x builds at 21.2%, while iOS 7.0.4 stood at just 4.9%.
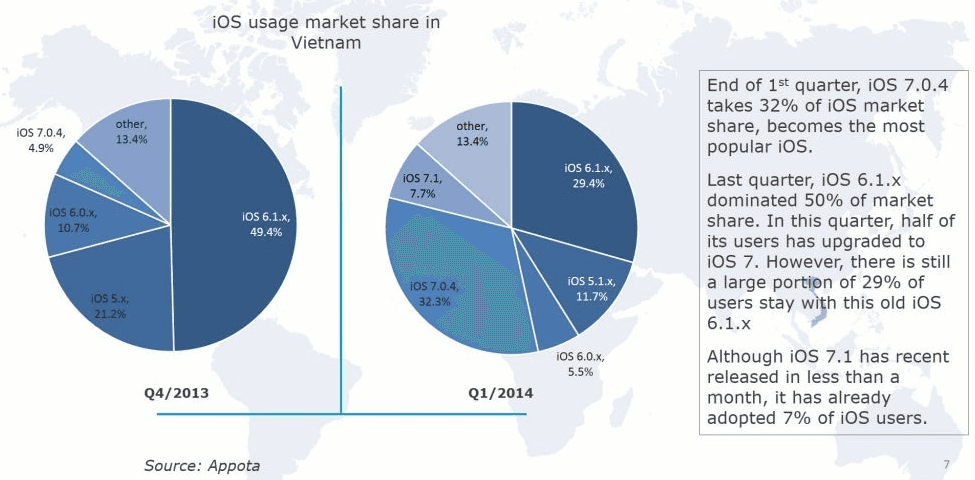
Within a single quarter, iOS 7.0.4 surged to become the most popular iOS version in Vietnam at 32.3% in Q1 2014 (rounded to 32% in the commentary). Simultaneously, iOS 7.1 captured 7.7% of active devices (rounded to 7% in the text) within less than a month of its public release. Combined, iOS 7 builds (7.0.4 and 7.1) accounted for 40.0% of all iOS devices in Vietnam. Meanwhile, iOS 6.1.x dropped by 20 percentage points to 29.4%, iOS 6.0.x declined to 5.5%, iOS 5.1.x fell to 11.7%, and other versions held steady at 13.4%.
By hardware form factor on slide 8, iPhone represented 70.82% of active iOS devices in Vietnam, iPad accounted for 27.09%, and the remaining unlabeled slice of roughly 2.09% belonged to iPod touch devices. Within the iPhone installed base, the iPhone 5 reached 19.5% share, representing a 4.5% increase over Q4 2013.
This hardware distribution directly shaped the three primary screen resolutions used for iOS web browsing in Vietnam:
320x480resolution (iPhone 4, iPhone 4S, and earlier models): Generated 53.5% of all iOS mobile web traffic in Q1 2014.768x1024resolution (iPad tablets): Ranked second at 27.1%, matching the 27.09% active iPad device share.320x568resolution (4-inch 16:9 display on iPhone 5/5C/5S): Accounted for 19.5% of web browsing traffic, mirroring the 19.5% iPhone 5 hardware share.
Android Jelly Bean Reaches 61.2% While Android 4.4 KitKat Lags at 4.6%
In contrast to Apple's unified upgrade cycle, Appota's Android telemetry on slide 9 highlights multi-version fragmentation across OEM handsets. In Q4 2013, Jelly Bean accounted for 41.3% of active Android devices in Vietnam, ahead of Ice Cream Sandwich (ICS) at 22.2%, Gingerbread (GB) at 8.2%, and other builds at 14.5% (the four labeled slices on the Q4 2013 pie chart total 86.2%).
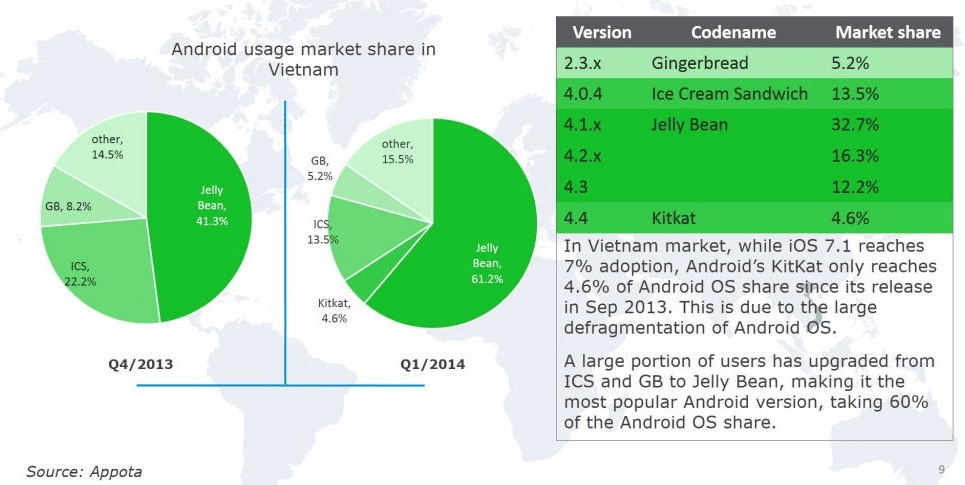
By Q1 2014, total Android Jelly Bean adoption in Vietnam expanded by nearly 20 percentage points to reach 61.2% (described as over 60% in the slide text). The accompanying breakdown table on slide 9 splits Jelly Bean across three point releases: 4.1.x led the entire Android platform at 32.7%, followed by 4.2.x at 16.3% and 4.3 at 12.2%. Legacy 4.0.4 Ice Cream Sandwich contracted to 13.5% and 2.3.x Gingerbread fell to 5.2%, with other versions at 15.5%.
Notably, Android 4.4 KitKat—despite being announced by Google in September 2013—accounted for only 4.6% of active Android devices in Vietnam by the end of Q1 2014. The report attributes this slow rollout compared with iOS 7.1's rapid 7.7% uptake to Android hardware fragmentation across manufacturers.
| Operating System | Version / Release Family | Q4 2013 Share | Q1 2014 Share | QoQ Shift (percentage points) |
|---|---|---|---|---|
| iOS | iOS 7.0.4 |
4.9% | 32.3% | +27.4 pp |
| iOS | iOS 7.1 |
Not yet released | 7.7% | +7.7 pp |
| iOS | iOS 6.1.x |
49.4% | 29.4% | -20.0 pp |
| iOS | iOS 6.0.x |
10.7% | 5.5% | -5.2 pp |
| iOS | iOS 5.x / 5.1.x |
21.2% | 11.7% | -9.5 pp |
| iOS | Other iOS versions (other) |
13.4% | 13.4% | 0.0 pp |
| Android | Jelly Bean total (4.1.x – 4.3) |
41.3% | 61.2% (4.1.x: 32.7%; 4.2.x: 16.3%; 4.3: 12.2%) |
+19.9 pp |
| Android | Ice Cream Sandwich (4.0.4) |
22.2% | 13.5% | -8.7 pp |
| Android | Gingerbread (2.3.x) |
8.2% | 5.2% | -3.0 pp |
| Android | KitKat (4.4) |
Not recorded | 4.6% | +4.6 pp |
| Android | Other Android versions (other) |
14.5% | 15.5% | +1.0 pp |
Android Screen Resolutions and the Four Samsung Models Leading Ad Impressions
On slide 10, Appota's web-browsing telemetry identifies five core screen resolutions across Android devices in Vietnam. Entry-level and mid-range 480x800 displays ranked first at 36.6%, closely followed by HD 720x1280 screens at 31.2% and Full HD 1080x1920 displays at 14.5%. The remaining traffic was split between 540x960 (qHD) at 9.5% and 800x1280 (phablets and tablets) at 8.1%.
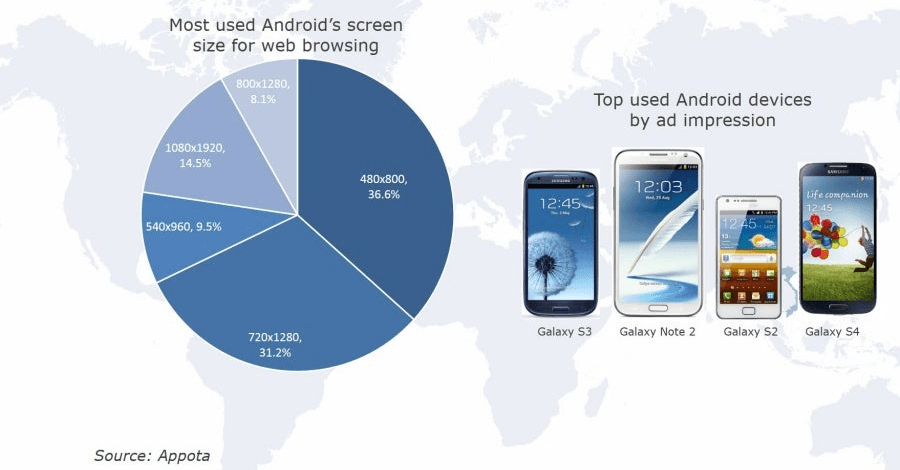
Measured by in-app advertising volume (top used Android devices by ad impression), all four leading Android handsets in Vietnam during Q1 2014 were manufactured by Samsung: Samsung Galaxy S3, Samsung Galaxy Note 2, Samsung Galaxy S2, and Samsung Galaxy S4. Engineering teams executing a mobile game soft launch checklist in Vietnam needed to prioritize UI scaling and memory profiling across these four Galaxy models as well as 480x800 (Android) and 320x480 (iOS) viewports.
| Platform | Web Browsing Screen Resolution | Q1 2014 Traffic Share | Representative Device Families |
|---|---|---|---|
| iOS | 320x480 |
53.5% | iPhone 4, iPhone 4S, iPhone 3GS |
| iOS | 768x1024 |
27.1% | iPad 2, iPad 3/4, iPad mini |
| iOS | 320x568 |
19.5% | iPhone 5, iPhone 5C, iPhone 5S |
| Android | 480x800 |
36.6% | Samsung Galaxy S2 and mid-range Android handsets |
| Android | 720x1280 |
31.2% | Samsung Galaxy S3, Samsung Galaxy Note 2 |
| Android | 1080x1920 |
14.5% | Samsung Galaxy S4 and Full HD flagships |
| Android | 540x960 |
9.5% | qHD smartphone segment |
| Android | 800x1280 |
8.1% | Android tablets and first-generation Galaxy Note |
How Did the Post-Flappy Bird Wave Propel "Made in Vietnam" Apps?
Slides 11 and 12 examine the creative and commercial ripple effects of Flappy Bird (created by Vietnamese developer Nguyễn Hà Đông) across domestic mobile studios during Q1 2014.
The Four-Trait Formula Behind Flappy Bird and Freaking Math
On slide 11, Appota deconstructs the gameplay loop that turned Flappy Bird into a global phenomenon into four defining attributes:
- Simple Design: Clean visual presentation and lightweight assets that communicate the objective immediately without tutorials.
- Easy to Play: One-touch controls tailored for short mobile sessions on the go.
- Extreme Difficult: Steep early difficulty curves that demand rapid reflexes and sustained concentration.
- Frustrated (High Replay Impulse): Near-miss losses at low scores that trigger immediate retry loops and competitive social-media score sharing.
Following this exact four-part blueprint in Q1 2014, Vietnamese indie developer Nguyễn Lương Bằng released Freaking Math, a fast-paced arithmetic puzzle game where players had only seconds to judge simple addition equations as true or false on a flat two-tone interface.
"Made in Vietnam" Games and Productivity Apps Reaching Global Charts
Beyond hyper-casual arcade titles, slide 12 highlights a broader wave of "Made in Vietnam" games and utilities climbing regional and global charts on Google Play and the Apple App Store in Q1 2014:
- School Cheater and Ninja Revenge: Two domestically developed mobile games that attracted strong international downloads through polished 2D art and fast arcade gameplay.
- INKredible: A vector-ink handwriting and note-taking app for tablets praised for its low-latency pen stroke engine.
- Fuzel: A creative animated photo-collage application built by a Vietnamese team that earned placement in Apple's Editor's Choice showcase on the App Store.
What Do the Q1 2014 Apple App Store and Google Play Rankings Reveal?
Chapter 3 of the report (slides 13–14) draws on Distimo store intelligence to compare the Top 5 Free Downloaded Apps and Top 5 Grossing Apps in Vietnam across the Apple App Store and Google Play during Q1 2014.
Top 5 Free Downloaded Apps: Social Networks, Local OTT Messaging, and Photo Utilities
On slide 13, free download activity in Vietnam was overwhelmingly concentrated in social networking, free OTT messaging, music streaming, and camera utilities.
| Rank | Top 5 Free Downloaded on Apple App Store (Publisher) | Top 5 Free Downloaded on Google Play Store (Publisher) |
|---|---|---|
| #1 | Facebook (Facebook) | Facebook (Facebook) |
| #2 | Camera360 Ultimate (PinGuo Inc) | Zalo (VNG) |
| #3 | Zalo (VNG) | Zing MP3 (VNG) |
| #4 | Facebook Messenger (Facebook) | Viber (Viber) |
| #5 | Zing MP3 (VNG) | Camera360 Ultimate (PinGuo Inc) |
Four applications appeared in the Top 5 across both stores: Facebook (ranking #1 on both iOS and Android), PinGuo Inc's selfie editor Camera360 Ultimate (#2 on iOS, #5 on Android), and VNG's domestic duo Zalo (#3 on iOS, #2 on Android) and Zing MP3 (#5 on iOS, #3 on Android). The remaining slots were held by Facebook Messenger (#4 on the App Store) and Viber (#4 on Google Play).
Top 5 Grossing Apps: Strategy and RPG Titles Command Store Monetization
While non-gaming utilities filled the free charts, mobile games captured all 10 slots of the Top 5 Grossing rankings on slide 14 across both platforms. Studios evaluating mobile game publishing in Vietnam can see the early monetization dominance of mid-core strategy and martial-arts RPG titles in the table below.
| Rank | Top 5 Grossing on Apple App Store (Publisher) | Top 5 Grossing on Google Play Store (Publisher) |
|---|---|---|
| #1 | Clash of Clans (Supercell) | Clash of Clans (Supercell) |
| #2 | Empire Fleet: Naval Warfare (gNetop) | Castle Clash (IGG.com) |
| #3 | Mộng Hiệp Khách (Koram) | Hay Day (Supercell) |
| #4 | Top Eleven – Be a soccer manager (Nordeus) | Age of Warring Empire (Silent Ocean) |
| #5 | Hay Day (Supercell) | Hero Dream (Efun) |
Finnish publisher Supercell led monetization across Vietnam, holding the #1 Top Grossing position on both the Apple App Store and Google Play with Clash of Clans, while placing Hay Day at #5 on iOS and #3 on Android. On the App Store, naval strategy title Empire Fleet: Naval Warfare (gNetop, #2), martial-arts RPG Mộng Hiệp Khách (Koram, #3), and football management sim Top Eleven (Nordeus, #4) rounded out the top five. On Google Play, base-building and RPG strategy titles dominated the remaining spots through Castle Clash (IGG.com, #2), Age of Warring Empire (Silent Ocean, #4), and Hero Dream (Efun, #5).
How Did Appota's Distribution Channels and Gamehub Perform in Q1 2014?
The final two chapters of the report (slides 15–21) detail the top-downloaded titles across Appota's domestic distribution channels and review three ecosystem milestones across Asia and Vietnam.
29 iOS Titles and 23 Android Titles Leading Downloads on Appota Channels
On slides 15 and 16, Appota lists—in alphabetical order—the 29 iOS apps and games and 23 Android apps and games that recorded the highest download volumes through Appota's distribution network in Q1 2014.
| Distribution Platform | Top Downloaded Mobile Games | Top Downloaded Utilities, Media & Social Apps |
|---|---|---|
| iOS (29 titles, slide 15) | Ải Mỹ Nhân, aSickForGame - Contra Huyền thoại, Au Mobile, Biệt Đội Thú Cưng, BigOne, Cờ Caro, Chém Chim Điên, Chiến Tiên, DotA Card, Egg shoot - Bắn Trứng, Flappy Bird, HeroDotA, Kiếm Hiệp - Nhất Đại Tông Sư, Mãnh Thú, Pocket Naruto Online, Phong Vân Truyền Kỳ, Thần bài 2013 - iWin Online, Thiên Hạ, Thiên Thần Truyện, Vua Bắn Cá, Xèng Hoa Quả (21 games) | Học từ vựng E3000, iPhim, LINE - Nhắn tin & Gọi điện miễn phí, NhacCuaTui, Tử Vi 2014, Viber, VietTV Pro - Xem Tivi Trực Tuyến, YAN TV, YAN News, YAN Radio (8 apps) |
| Android (23 titles, slide 16) | Ải Mỹ Nhân, Au Mobile, Biệt Đội Thú Cưng, Chiến Tiên, Flappy Bird, HeroDotA, Hoàng Đế, Kiếm Hiệp - Nhất Đại Tông Sư, Nấm Mario, Ông Trùm, Pocket Naruto Online, Q Tiên, Thiên Hạ, Thiên thần truyện (14 games) | Báonet Android - Đọc báo FREE, Bói Kiều, Camera360 Ultimate Việt hóa, Gõ Tiếng Việt 3, Phim Vietsub - Phim HD, Anime HD, Tivi HD miễn phí, Tìm WiFi Chùa, Từ điển Anh-Việt, UC Browser, Viber (Việt hóa) (9 apps) |
Ten games appeared simultaneously among the top downloads on both iOS and Android: Ải Mỹ Nhân, Au Mobile, Biệt Đội Thú Cưng, Chiến Tiên, Flappy Bird, HeroDotA, Kiếm Hiệp - Nhất Đại Tông Sư, Pocket Naruto Online, Thiên Hạ, and Thiên Thần Truyện. On Android, Vietnamese-localized utilities—such as Gõ Tiếng Việt 3 (Vietnamese keyboard), Từ điển Anh-Việt (English–Vietnamese dictionary), localized builds of Camera360 Ultimate and Viber, news reader Báonet Android, and Wi-Fi finder Tìm WiFi Chùa—drove substantial organic installation volume.
Regional Expansion in Singapore and Beijing Alongside the Launch of Gamehub.vn
Slides 17 through 21 document three strategic initiatives executed by Appota during Q1 2014:
- 1st Asia Leaders Summit in Singapore (February 15–16, 2014, slide 17): Appota participated as the sole Vietnamese startup enterprise presenting to regional investors and executives at Marina Bay Sands, Singapore, laying the groundwork for regional expansion across Asia through its Singapore branch office at 10 Anson Road, #26-04 International Plaza.
- Global Mobile Game Congress (GMGC) 2014 in Beijing (March 26–27, 2014, slide 18): Appota Founder and CEO Mr. Đỗ Tuấn Anh spoke on the "Opportunities and Challenges - South East Asia" panel at the China National Convention Center in Beijing, sharing market benchmarks and cross-border publishing opportunities in Vietnam.
- Launch of Gamehub.vn and Developer Support Program (March–June 2014, slides 19–20): Appota launched Gamehub (
gamehub.vn), Vietnam's first dedicated mobile gaming portal featuring news, video reviews, and a large-scale giftcode repository (the portal screenshot on slide 19 highlights active giftcode allocations including Dota Card by Sgen with 500 codes, Hãn Tướng by Gamota with 300 codes, Mãnh Tướng by CMN with 300 codes, Ngộ Tiên by Soha Game with 202 codes, and iGà by Soha with 200 codes).
From March to June 2014, Appota operated a complimentary developer support program on Gamehub providing rapid news coverage and game reviews, giftcode distribution, gamer video interviews, and event promotion across a community network of 1,000,000+ Facebook fans, 20+ gaming and tech forums, and 50,000+ YouTube subscribers.
Strategic Takeaways for Mobile App and Game Publishers
Synthesizing Appota's Q1 2014 dataset yields four actionable priorities for product, engineering, and publishing teams operating in Vietnam:
- Prioritize Multi-Resolution Asset Scaling Across Legacy Viewports: With 53.5% of iOS web traffic still coming from
320x480screens (iPhone 4/4S) and 36.6% of Android traffic on480x800displays, studios cannot optimize solely for 1080p or 4-inch Retina screens. Building universal apps—practiced by 74% of developers globally—while scaling UI layouts across768x1024(iPad) and720x1280(Galaxy S3, Note 2) covers over 85% of active domestic devices. - Decouple OS SDK Targets Between iOS 7 and Android Jelly Bean: On iOS, rapid adoption of
iOS 7.0.4(32.3%) andiOS 7.1(7.7%) allows developers to adopt iOS 7 frameworks while preserving backward compatibility foriOS 6.1.x(29.4%). On Android, QA matrices must focus on Jelly Bean4.1.x–4.3(61.2%) and4.0.4 ICS(13.5%) rather than relying on Android 4.4 KitKat APIs (4.6%). - Pair Viral Social Mechanics with Localized Payment Infrastructure: The sharp divide between Top Free apps (Facebook, Zalo, Viber, Zing MP3, Camera360) and Top Grossing games (Clash of Clans, Castle Clash, Mộng Hiệp Khách, Hay Day) underscores two distinct monetization paths. Indie studios following the Flappy Bird and Freaking Math formula can scale via social score-sharing and in-app ads, whereas mid-core RPG and strategy publishers should prepare localized billing channels using a structured payment gateway integration checklist.
- Leverage Third-Party Distribution and Specialized Gaming Communities: As organic discovery on global app stores tightens, partnering with third-party distribution channels like Appota and distributing giftcodes through Gamehub.vn's 1M+ Facebook fan network lowers user acquisition friction across both iOS and Android.
Sources
- Mobile Market Report Quarter I - 2014 (Vietnam mobile game & mobile application market overview in Q1.2014), Công ty Cổ phần Appota (Appota Editors Team / Appota Group), 2014-04-09, accessed 2026-11-02
- Worldwide Smartphone Sales to End Users by Operating System & Android Device Manufacturer Market Share (Q4 2013 – Q1 2014), Localytics & Gartner, 2014-02-13, accessed 2026-11-02
- App Store & Google Play Global Revenue/Download Share (Sep 2013 – Feb 2014) & Vietnam Q1 2014 Top 5 Free and Grossing Charts, Distimo (nay thuộc data.ai / Sensor Tower), 2014-03-25, accessed 2026-11-02
- State of the Apps Industry — Developer Content Categories & Universal App Adoption (Q1 2014), Millennial Media, 2014-03-01, accessed 2026-11-02
- Hệ thống phân phối ứng dụng Appota và cổng thông tin Gamehub.vn (Quý 1/2014), Công ty Cổ phần Appota (Appota Group), 2014-04-09, accessed 2026-11-02