
Vietnam Mobile Content Market Report Q3 2014
Appota's Vietnam mobile content market report for Q3 2014 surveys over 15,000,000 domestic smartphone users alongside global benchmarks. Asia Pacific smartphone shipments topped 160 million units in Q2 2014, while in Vietnam Android Jelly Bean held 65%, iOS 7.x reached 67%, iPad usage climbed to 37.06%, and Appota launched the onClan mobile gaming social network.
Analysis of global smartphone shipments, Google Play vs. App Store download and revenue gaps, Vietnam's Android Jelly Bean (65%), iOS 7.x (67%), and iPad (37.06%) shares, Top 10 apps, and the launch of the onClan mobile gaming social network in Q3 2014.
Key findings
- 15,000,000+ user samplePrimary domestic telemetry in the report was collected during the last 3 weeks of each quarter across a sample of more than 15,000,000 Vietnamese smartphone users actively using Appota's content distribution platform.
- 295.0M & >160M shipmentsGlobal quarterly smartphone shipments expanded from 55.4 million units in Q1 2010 to 295.0 million units in Q2 2014 (a 5.32x increase across 18 quarters), propelled by the Asia Pacific region surpassing 160 million units in Q2 2014 on the strength of cost-effective Android phones (Android Authority).
- +60% downloads & +60% revenueIn Q3 2014, global app downloads on Google Play exceeded the Apple App Store by 60% (index 160 vs. 100, widening from +25% in Q3 2013); conversely, global app revenue on the App Store remained 60% higher than on Google Play (index 100 vs. 100/160, narrowing from a 2.1x lead in Q3 2013) (App Annie).
- 4.84 – 2.74 downloads/capitaThree Southeast Asian markets led InMobi's 10-country ranking of app downloads per capita, headed by Malaysia (4.84 downloads per person), Indonesia (4.15), and the Philippines (2.74), ahead of South Korea (2.45), Taiwan (2.11), and the United States (1.25) (InMobi).
- 65% Jelly Bean & 27% KitKatBy the end of Q3 2014 in Vietnam, Android Jelly Bean accounted for 65% of active Android devices and KitKat reached 27% (92% combined), outpacing the global split of 54% Jelly Bean and 25% KitKat; legacy Android builds in Vietnam fell to 6% Ice Cream Sandwich and 2% earlier versions (Appota, Google).
- 10.73% Android tabletsVietnam's active Android hardware base at the close of Q3 2014 comprised 89.27% smartphones and 10.73% tablets, with Android tablet usage edging down gradually from 11% in Q4 2013 to 10.73% in Q3 2014 (Appota).
- 67% iOS 7.x & 1% iOS 8.xWithin Vietnam's iOS ecosystem at the end of Q3 2014, iOS 7.x held 67% and iOS 6.x retained 25%, whereas newly released iOS 8.x stood at just 1% due to low penetration of new iDevices and user preference for jailbroken operating systems; globally, iOS 8.x and iOS 7.x were tied at 47% each (Appota, Apple App Store).
- 37.06% iPad & onClan launchiPad usage within Vietnam's iOS base rose from 30% in Q2 2014 to 37.06% in Q3 2014 alongside 61.8% for iPhone; during Q3 2014, Appota also officially launched the onClan social network for mobile gaming at TechCrunch Disrupt in San Francisco (after winning 3rd Prize and the Global Brain Award at StartupAsia Arena in Tokyo) and released the onClan SDK for iOS (Appota).
How Did Global Hardware Shipments and Store Economics Shape the Vietnam Mobile Content Market?
Published on October 21, 2014 by Appota, the Q3 2014 Vietnam mobile content market report (Vietnam Mobile Content Market Report Q3 - 2014) examines global hardware supply chains, app store monetization, domestic operating system adoption, and social gaming infrastructure. As noted on slide 2, all domestic metrics were collected during the final three weeks of each quarter across a sample of more than 15,000,000 Vietnamese smartphone users on Appota's platform.
Readers following our Gaming research can pair this study with the Vietnam Mobile Market Report Q1 2014. Chapter 1 (slides 3–8) establishes the international context using datasets from Android Authority, App Annie, and InMobi.
Asia Pacific Drives Global Smartphone Shipments to 295.0 Million Units
According to Android Authority data on slide 4, worldwide smartphone shipments expanded steadily across the 18 quarters from Q1 2010 through Q2 2014. Quarterly global volume rose from 55.4 million units in Q1 2010 to 295.0 million units in Q2 2014, a 5.32-fold increase over four and a half years.
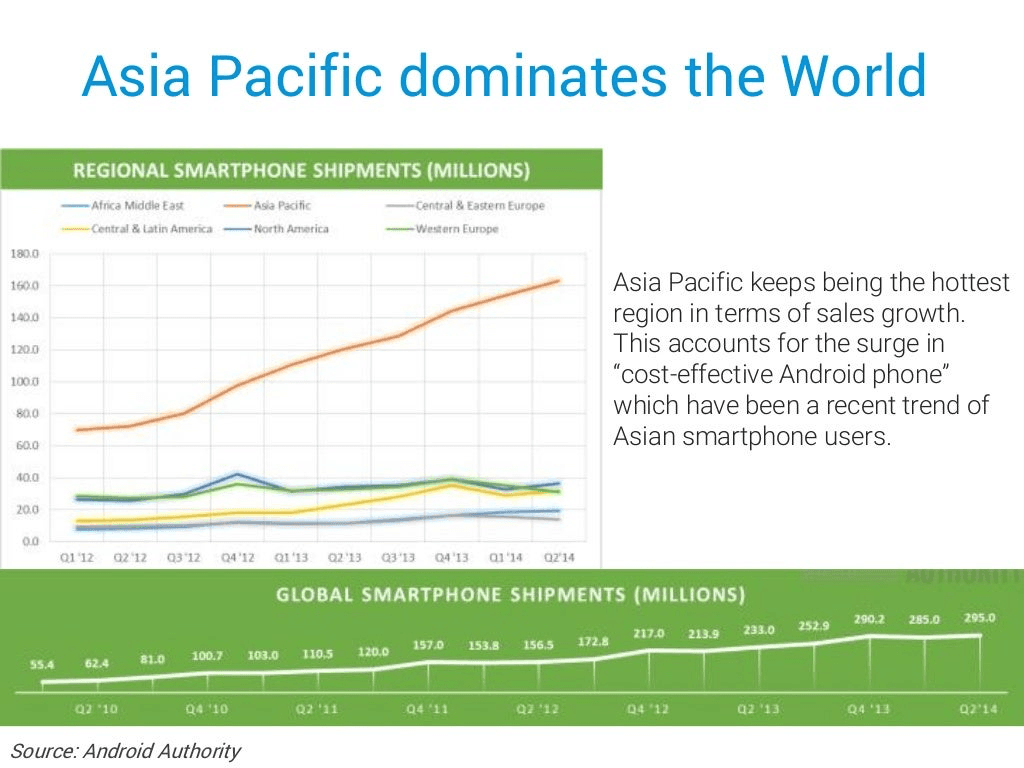
The primary growth engine was the Asia Pacific region. On the six-region chart from Q1 2012 to Q2 2014 (slide 4), quarterly shipments in Asia Pacific climbed from roughly 70 million units in Q1 2012 to over 160 million units (approximately 163–164 million) in Q2 2014. Cost-effective Android phones enabled Asia Pacific to far outpace North America (~37 million units in Q2 2014) and Western Europe (~31 million).
| Year | Q1 (Millions) | Q2 (Millions) | Q3 (Millions) | Q4 (Millions) | Source (Slide) |
|---|---|---|---|---|---|
| 2010 | 55.4 | 62.4 | 81.0 | 100.7 | Android Authority (slide 4) |
| 2011 | 103.0 | 110.5 | 120.0 | 157.0 | Android Authority (slide 4) |
| 2012 | 153.8 | 156.5 | 172.8 | 217.0 | Android Authority (slide 4) |
| 2013 | 213.9 | 233.0 | 252.9 | 290.2 | Android Authority (slide 4) |
| 2014 | 285.0 | 295.0 | Not reported | Not reported | Android Authority (slide 4) |
Global shipments consistently peaked in Q4 (100.7 million in Q4 2010, 157.0 million in Q4 2011, 217.0 million in Q4 2012, and 290.2 million in Q4 2013) before easing slightly in Q1. In Q2 2014, however, shipments reached 295.0 million units, surpassing the prior Q4 holiday peak.
Samsung and Apple Cede Ground to Rising Asian OEMs
On slide 5, Android Authority's 100% stacked area chart tracks global smartphone market share across 13 OEM brands from Q2 2008 to Q2 2014: Samsung, Apple, Huawei, Lenovo, Xiaomi, LG, Coolpad, ZTE, Sony, TCL-Alcatel, Motorola, Nokia, and HTC.
Whereas Nokia and HTC led between 2008 and 2010, Samsung and Apple held the top two positions from 2011 onward. Even so, the combined share of Samsung and Apple dipped slightly in Q2 2014 compared with Q1 2014 as smaller Asian manufacturers — including Huawei, Lenovo, Xiaomi, Coolpad, and ZTE — expanded their mid-range Android shipments.
Google Play Widens Its Download Lead to 60% While App Store Keeps a 60% Revenue Lead
Using App Annie data across five quarters (Q3 2013 – Q3 2014) on slides 6 and 7, the report indexes the Apple App Store at 100 to track Google Play's relative download volume and consumer revenue.
On downloads (slide 6), Google Play widened its lead every quarter. From an index of 125 vs. 100 in Q3 2013 (+25%), Google Play rose by 10 points per quarter to 135 in Q4 2013 (+35%), 145 in Q1 2014 (+45%), 155 in Q2 2014 (+55%), and 160 in Q3 2014 (+60% higher than the App Store).
| Quarter | App Store Downloads | Google Play Downloads | Download Gap | Google Play Revenue Ratio | App Store Revenue Lead | Source (Slides) |
|---|---|---|---|---|---|---|
| Q3 2013 | 100 | 125 | Google Play +25% | 100/210 | App Store +110% (2.10x) | App Annie (slides 6–7) |
| Q4 2013 | 100 | 135 | Google Play +35% | 100/200 | App Store +100% (2.00x) | App Annie (slides 6–7) |
| Q1 2014 | 100 | 145 | Google Play +45% | 100/185 | App Store +85% (1.85x) | App Annie (slides 6–7) |
| Q2 2014 | 100 | 155 | Google Play +55% | 100/180 | App Store +80% (1.80x) | App Annie (slides 6–7) |
| Q3 2014 | 100 | 160 | Google Play +60% | 100/160 | App Store +60% (1.60x) | App Annie (slides 6–7) |
On revenue (slide 7), the Apple App Store maintained a substantial lead. In Q3 2013, Google Play's bar stood at 100/210 against the App Store's 100 (meaning App Store revenue was 2.10x, or 110% higher). That gap narrowed steadily to 100/200 in Q4 2013 (2.00x), 100/185 in Q1 2014 (1.85x), 100/180 in Q2 2014 (1.80x), and 100/160 in Q3 2014 — where App Store revenue remained 60% higher (1.60x) than Google Play.
Southeast Asia Sweeps the Top Three Spots in Per-Capita App Downloads
On slide 8, mobile ad network InMobi ranked the top 10 countries and territories by app downloads per capita. Southeast Asian nations occupied all three top spots globally.
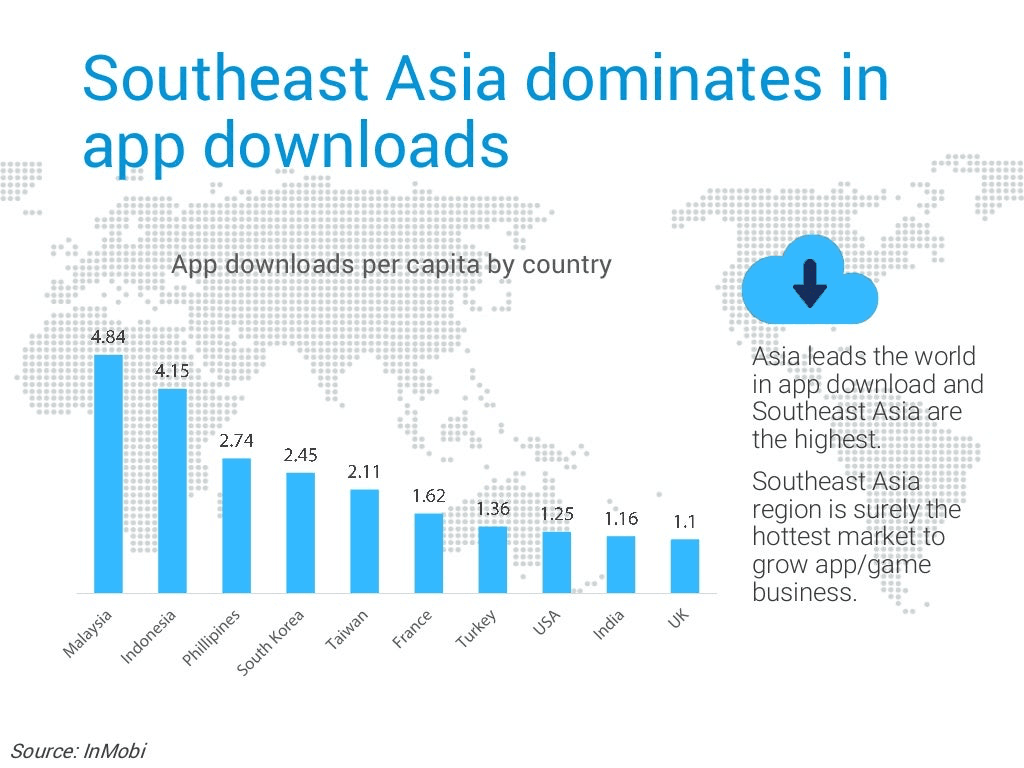
According to InMobi, Malaysia led with 4.84 downloads per capita, followed by Indonesia (4.15) and the Philippines (spelled Phillipines on the slide, at 2.74). South Korea (2.45) and Taiwan (2.11) ranked fourth and fifth, ahead of France (1.62), Turkey (1.36), the United States (1.25), India (1.16), and the United Kingdom (1.1).
| Rank | Country / Territory | Region | Downloads per Capita | Source (Slide) |
|---|---|---|---|---|
| 1 | Malaysia | Southeast Asia | 4.84 | InMobi (slide 8) |
| 2 | Indonesia | Southeast Asia | 4.15 | InMobi (slide 8) |
| 3 | Philippines (Phillipines) | Southeast Asia | 2.74 | InMobi (slide 8) |
| 4 | South Korea | East Asia | 2.45 | InMobi (slide 8) |
| 5 | Taiwan | East Asia | 2.11 | InMobi (slide 8) |
| 6 | France | Western Europe | 1.62 | InMobi (slide 8) |
| 7 | Turkey | Eurasia | 1.36 | InMobi (slide 8) |
| 8 | United States (USA) | North America | 1.25 | InMobi (slide 8) |
| 9 | India | South Asia | 1.16 | InMobi (slide 8) |
| 10 | United Kingdom (UK) | Western Europe | 1.10 | InMobi (slide 8) |
How Did Android and iOS Versions Fragment Across the Vietnam Mobile Content Market in Q3 2014?
Chapter 2 (slides 9–15) benchmarks Appota's domestic telemetry from 15 million Vietnamese users against global OS distributions from Google and the Apple App Store through the end of Q3 2014. While Vietnam's Android base concentrated heavily in Jelly Bean and KitKat, domestic iOS users lagged far behind global iOS 8 adoption.
Android OS Share: 65% Jelly Bean, 27% KitKat, and 10.73% Tablets
According to Appota and Google data on slide 10, Android Jelly Bean (4.1–4.3) led both Vietnam and the world at the close of Q3 2014. In Vietnam, Jelly Bean captured 65% and KitKat (4.4) held 27% (a combined 92%), leaving Ice Cream Sandwich (ICS 4.0) at 6% and Earlier versions at 2%.
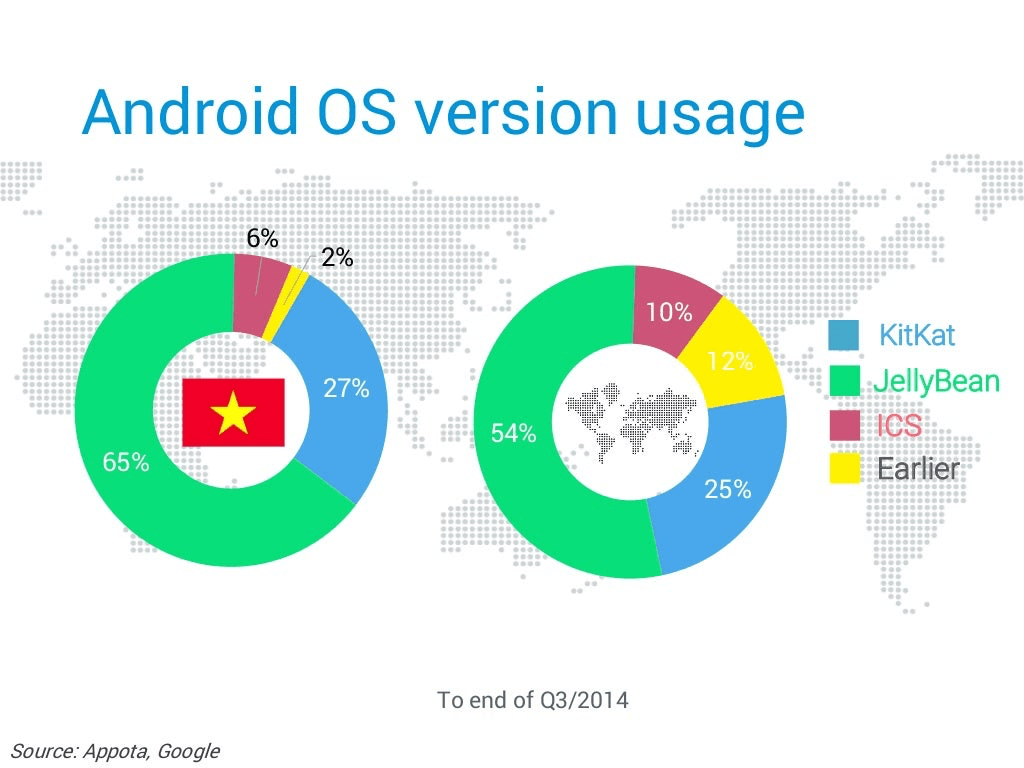
Globally (Google data on slide 10, where rounded labels sum to 101%), Jelly Bean stood at 54% and KitKat at 25% (79% combined), while ICS (10%) and Earlier (12%) still accounted for 22%. As shown on slide 11, Vietnam's KitKat share rose from 0% (Q4 2013) to roughly 5% (Q1 2014), 11% (Q2 2014), and 27% in Q3 2014 as new handsets shipped with Android 4.4.
By device type on slide 12, Android smartphones represented 89.27% of domestic Android traffic and Android tablets accounted for 10.73%, edging down from 11% in Q4 2013.
| OS Version | Vietnam Share (Q3 2014) | Global Share (Q3 2014) | Vietnam Trajectory (Q4 2013 → Q3 2014) | Source (Slides) |
|---|---|---|---|---|
| Android Jelly Bean | 65% | 54% | ~42% (Q4/13) → ~61% (Q1) → ~60% (Q2) → 65% (Q3/14) | Appota, Google (slides 10–11) |
| Android KitKat | 27% | 25% | 0% (Q4/13) → ~5% (Q1) → ~11% (Q2) → 27% (Q3/14) | Appota, Google (slides 10–11) |
| Android ICS | 6% | 10% | ~22% (Q4/13) → ~13% (Q1) → ~12% (Q2) → 6% (Q3/14) | Appota, Google (slides 10–11) |
| Android Earlier | 2% | 12% | ~36% (Q4/13) → ~21% (Q1) → ~17% (Q2) → 2% (Q3/14) | Appota, Google (slides 10–11) |
| iOS 7.x | 67% | 47% | ~5% (Q4/13) → ~40% (Q1) → ~53% (Q2) → 67% (Q3/14) | Appota, Apple (slides 13–14) |
| iOS 8.x | 1% | 47% | Launched early Sep 2014; 1% in Vietnam by end of Q3 2014 | Appota, Apple (slides 13–14) |
| iOS 6.x | 25% | In 6% legacy | ~60% (Q4/13) → ~35% (Q1) → ~29% (Q2) → 25% (Q3/14) | Appota, Apple (slides 13–14) |
| iOS Earlier | 7% | In 6% legacy | ~35% (Q4/13) → ~25% (Q1) → ~18% (Q2) → 7% (Q3/14) | Appota, Apple (slides 13–14) |
Why Only 1% of Vietnamese iOS Users Upgraded to iOS 8 as iPad Hit 37.06%
Globally, iOS 8.x reached 47% on the Apple App Store by the end of Q3 2014 (slide 13), tying iOS 7.x (47%) and compressing iOS 6.x and Earlier to 6%. In Vietnam, by contrast, only 1% of active iOS devices ran iOS 8.x at the end of Q3 2014, while iOS 7.x held 67%, iOS 6.x retained 25%, and Earlier builds accounted for 7%.
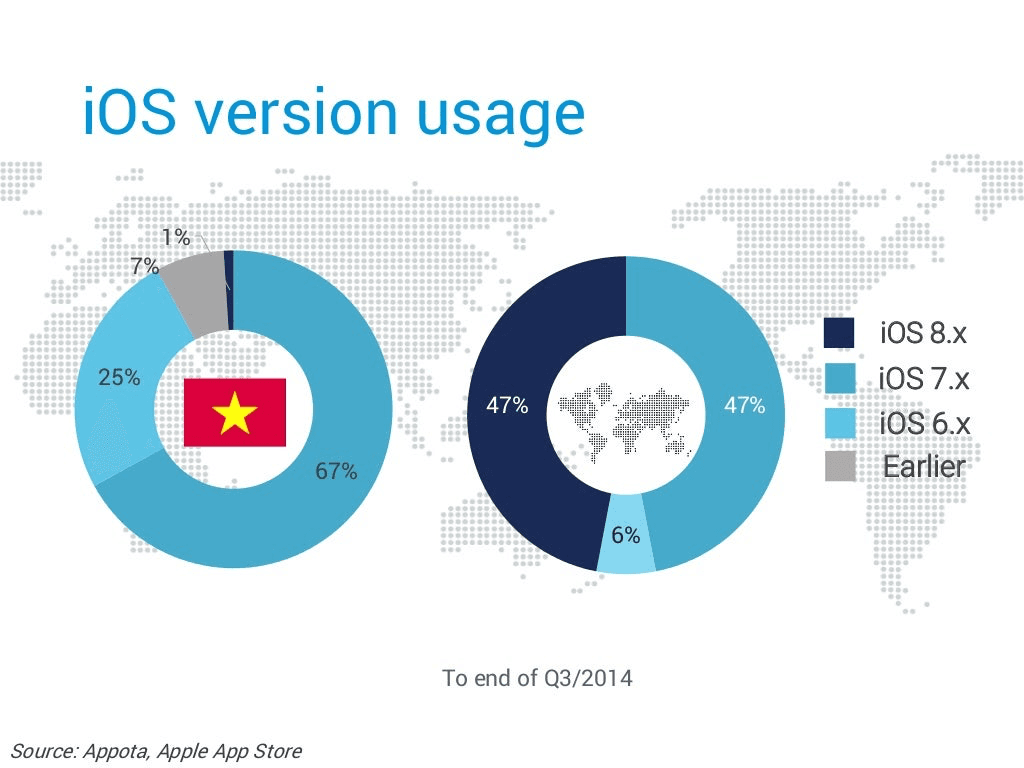
Slide 14 attributes Vietnam's 1% iOS 8 adoption to two factors: low initial penetration of new iDevices (iPhone 6/6 Plus) in September 2014, and strong user preference for retaining jailbroken iOS 7.x or iOS 6.x builds. Consequently, studios planning mobile game publishing in Vietnam needed to preserve compatibility with iOS 6.x and iOS 7.x.
Meanwhile, slide 15 shows that iPad share within Vietnam's iOS ecosystem rose from 30% in Q2 2014 to 37.06% (rounded to 37% in the slide text) in Q3 2014, alongside 61.8% for iPhone (and 1.14% for iPod touch). Strong tablet adoption made iPad a key revenue driver for mid-core RPG and strategy titles in Vietnam.
Top 10 Downloaded Apps and the Launch of the onClan Gaming Network
Chapter 3 (slides 16–20) presents the 10 most downloaded iOS and Android apps distributed by Appota in Q3 2014 and details the international launch of onClan.
Top 10 Downloaded iOS and Android Apps on Appota's Network
On slide 17, three games ranked in both Top 10 charts simultaneously: Đoán chữ (rank 1 iOS, rank 7 Android), Chiến Tiên (rank 1 Android, rank 10 iOS), and Đập Chuột (rank 5 Android, rank 8 iOS). Online RPGs and strategy games filled the top ranks on both platforms, including Thiên Thần Truyện, Pocket Naruto Online, Thiên tướng giáng hạ, and Vua trò chơi on Android, alongside Tây Du Giáng Ma, Bóng Đá Chưởng, Au Mobile, Ải Mỹ Nhân, and Thiên Mệnh 4D on iOS.
| Rank | Top 10 iOS Apps (Appota Q3 2014) | iOS Genre | Top 10 Android Apps (Appota Q3 2014) | Android Genre |
|---|---|---|---|---|
| 1 | Đoán chữ | Word puzzle game | Chiến Tiên | Eastern fantasy MMORPG |
| 2 | Karaoke Viet Nam (Au Mobile icon) | Rhythm game (duplicate label) | Thiên Thần Truyện | Action RPG |
| 3 | Tây Du Giáng Ma | Action RPG | Pocket Naruto Online | Anime card strategy |
| 4 | Bóng Đá Chưởng | Football RPG strategy | Thiên tướng giáng hạ | Strategy RPG |
| 5 | Au Mobile | Music & dance game | Đập chuột | Casual arcade game |
| 6 | Ải Mỹ Nhân | Martial arts MMORPG | Vua trò chơi | Card battle strategy |
| 7 | Karaoke Viet Nam (57238 icon) | Karaoke code lookup app | Đoán chữ | Word puzzle game |
| 8 | Đập Chuột | Casual arcade game | Bé học số và hình khối | Kids math & shapes app |
| 9 | Thiên Mệnh 4D | Martial arts RPG | Từ điển Anh Việt, Việt Anh | Bilingual dictionary |
| 10 | Chiến Tiên | Eastern fantasy MMORPG | La bàn số, la bàn phong thủy | Feng Shui compass utility |
On the original slide 17 iOS table, rank 2 printed the label "Karaoke Viet Nam" next to the Au Mobile icon, while the actual Karaoke Viet Nam songbook app (57238 icon) ranked 7th. On Android, ranks 8–10 were held by Vietnamese education and reference apps (Bé học số và hình khối, Từ điển Anh Việt, Việt Anh, and La bàn số, la bàn phong thủy).
Official Release of the onClan Social Gaming Network and iOS SDK
Slides 18–19 highlight Appota's launch of onClan, introduced as the first social network for mobile gaming. Prior to release, onClan won 3rd Prize and the Global Brain Award at StartupAsia Arena in Tokyo, and was officially launched and exhibited at TechCrunch Disrupt in San Francisco in September 2014.
Slide 19 also announces the release of the onClan SDK for iOS (with the Android SDK following soon after), giving developers two plug-and-play social modules:
- In-game chat and social functions: Direct player messaging, clan management, and guild chat inside the game interface.
- Achievement sharing and leaderboards: Social scoreboards and achievement feeds that reinforced player retention, laying groundwork for the community systems later examined in the Vietnam Mobile Game Market Report 2024.
Strategic Takeaways for Mobile Developers and Publishers
Three operational priorities emerge from Appota's Q3 2014 dataset:
- Combine Android user acquisition with iOS and iPad monetization: Use Google Play's +60% download volume and Vietnam's 89.27% Android smartphone share to scale installs, while tailoring tablet UI and in-app purchase bundles for iPhone (61.8%) and iPad (37.06%) users on the App Store (+60% revenue).
- Support Android Jelly Bean (65%) and iOS 6.x–7.x (92%): Because only 1% of Vietnamese iOS users upgraded to iOS 8 in Q3 2014 due to jailbreak retention, client builds needed full compatibility with iOS 6.x (25%), iOS 7.x (67%), and Android 4.1–4.3 Jelly Bean (65%).
- Integrate in-game chat and clan systems: The dominance of online RPGs (Chiến Tiên, Thiên Thần Truyện, Tây Du Giáng Ma) and the rollout of the onClan SDK confirmed that social guild mechanics were central to long-term retention in Vietnam.
Sources
- Vietnam Mobile Content Market Report Q3 - 2014 (Báo cáo thị trường nội dung di động Việt Nam quý 3/2014), Công ty Cổ phần Appota (Appota Group), 2014-10-21, accessed 2026-11-02
- Global & Regional Smartphone Shipments and Market Share by Brand (Q1 2010 – Q2 2014), Android Authority, 2014-08-15, accessed 2026-11-02
- App Annie Index: Market Q3 2014 — Global App Downloads and Revenue by Store (Q3 2013 – Q3 2014), App Annie (nay là data.ai / Sensor Tower), 2014-10-15, accessed 2026-11-02
- Global Mobile App Downloads Per Capita by Country (2014), InMobi, 2014-09-01, accessed 2026-11-02
- Global Android Platform Versions & Apple App Store iOS Distribution (End of Q3 2014), Google (Android Developers Dashboard) & Apple App Store, 2014-10-01, accessed 2026-11-02
- Dữ liệu thiết bị Việt Nam quý 4/2013 – quý 3/2014, bảng xếp hạng phân phối Appota và nền tảng mạng xã hội game onClan, Công ty Cổ phần Appota (Appota Group), 2014-10-21, accessed 2026-11-02