
Vietnam Holiday Mobile Advertising and App Monetization Report 2018
Adsota's 2018 Vietnam holiday mobile advertising and app monetization report examines Lunar New Year install surges, in-app ad spend, and international eCPM benchmarks. Across the seven-day Tet holiday, daily in-app ad requests in Vietnam jumped 32% and lifted indexed eCPM to 222X, outperforming both Japan (100X) and South Korea (133X).
An executive analysis of pre-Tet app install peaks, +32% in-app ad requests, 222X Lunar New Year eCPMs, device monetization gaps, and US holiday benchmarks from Adsota.
Key findings
- +32% Tet ad requestsDaily mobile in-app ad request growth in Vietnam across the seven-day Lunar New Year holiday versus average January–February days, ranking second in APAC behind China (+35%) and ahead of Taiwan (+16%) and Singapore (+14%) according to Smaato (2017–2018).
- 222X Lunar New Year eCPMVietnam's indexed in-app advertising revenue (eCPM) during the Lunar New Year against a Japan = 100X baseline, ranking fourth in APAC behind China (656X), Singapore (300X), and the Philippines (244X) while surpassing Malaysia (167X) and South Korea (133X) per Appodeal and Smaato (2017–2018).
- 7–10 days pre-Tet peakWindow when daily iOS App Store downloads in Vietnam peaked ahead of the Lunar New Year (Adsota recommends launching user acquisition 10–15 days pre-Tet), whereas within the seven-day holiday installs peaked on Tet Day 1 and dropped sharply on Day 2 per App Annie (2017–2018).
- 42% Productivity installsShare of total APAC Lunar New Year app downloads captured by Productivity apps; by contrast, Music & Video Entertainment, Arcade games, and Social & Communication led actual active screen time during the holiday per AppFlood Network and InMobi (2015–2017).
- 153X & +30% on iOSiOS devices generated 30% higher overall in-app eCPM than Android and reached an indexed 153X (with High-End Android at 134X vs. Budget Android at 100X), even though Budget Android captured 39% of ad spend and 49% of impressions per Smaato and InMobi (2017–2018).
- 5–6x Banner eCPMRewarded ads ranked first in eCPM across four major in-app formats, followed by Interstitial ads delivering 3x the eCPM of Native ads and roughly 5–6x Banner ads, while Native ads generated nearly double Banner eCPMs per Appodeal, Google, and Smaato (2017–2018).
- 23% Healthcare ad shareHealthcare advertisers accounted for 23% of holiday brand ad spend inside News apps across APAC versus just 4% in Game apps, whereas Retail captured the largest share on Social apps and ranked second on both Game and News apps per Smaato (2017–2018).
- 20% revenue & 1,889X eCPMThe United States generated 20% of international revenue and 11% of overseas downloads for Vietnamese app publishers (India led downloads at 13% per Google, 2017), while delivering an average 1,889X indexed eCPM (Japan = 100X) and Super Bowl spikes of nearly +300% spend and +50% eCPM per Appodeal and Smaato (2017–2018).
How does Vietnam holiday mobile advertising shift app downloads and usage around Tet?
Published in January 2019 by Adsota, this study of Vietnam holiday mobile advertising and in-app monetization tracks how extended public holidays reshape user acquisition, brand media budgets, and publisher yields. According to We Are Social, Google, and Nielsen data for 2018 cited on page 5 of the report, Vietnam operated on a population base of 95.6 million.
Mobile phone users accounted for 73% and smartphone users reached 42% (measured as a share of the total adult population in the English PDF, whereas the Vietnamese edition labels both against total population). Active mobile social media users reached 50 million, representing 52% of the total population.
Across the calendar year, four public holiday windows influence Vietnamese mobile traffic: New Year's Day (January 1), Reunification Day and International Labour Day (April 30 – May 1), Independence Day (September 2), and the Lunar New Year (Tet). Unlike single-day civic holidays, Tet spans roughly seven to nine consecutive days off nationwide: February 6–14, 2016; January 26 – February 1, 2017; February 14–20, 2018; and February 2–10, 2019.
Alongside China, Vietnam observes one of the longest Lunar New Year breaks in the Asia-Pacific (APAC) region. When tens of millions of workers and students step away from desktops for over a week, smartphones become the primary screen for messaging, entertainment, and news, driving simultaneous spikes in ad inventory and effective Cost Per Mille (eCPM).
The 7–10 day pre-Tet install peak and the Day-2 holiday trough
Daily iOS App Store download tracking in Vietnam from App Annie across the 2017 Tet window (January 16 – February 8, 2017) and the 2018 Tet window (February 4–27, 2018) reveals two recurring seasonal patterns.
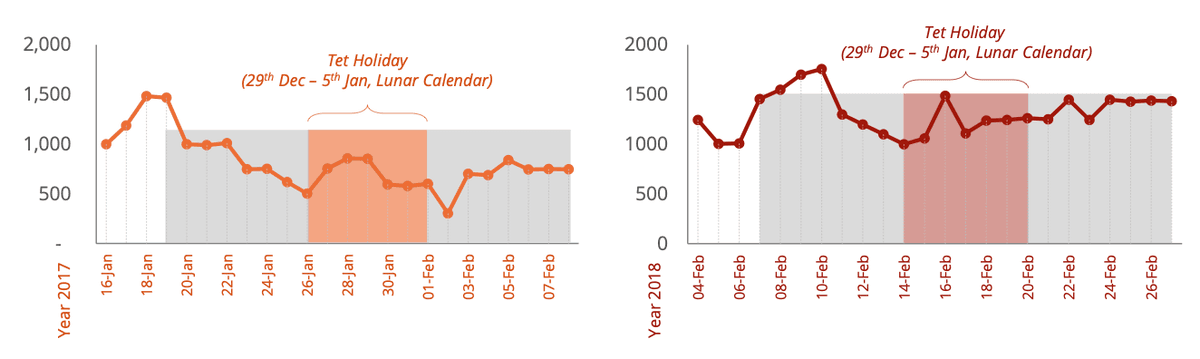
App Annie's daily curves demonstrate that app discovery peaks well before families begin their holiday travel:
- Full-season downloads peak 7–10 days before Tet: In both 2017 (peaking January 18–19 ahead of the January 26 – February 1 break) and 2018 (peaking February 9–10 ahead of the February 14–20 break), daily installs hit their highest level roughly one week to ten days prior to the holiday. Adsota therefore advises launching user acquisition (UA) campaigns 10–15 days before Tet.
- Holiday installs spike on Tet Day 1 and plunge on Day 2: Across the seven official holiday days (29th of the twelfth lunar month through the 5th day of the new year), downloads surge to an in-holiday high on the 1st day of Tet (January 28, 2017 and February 16, 2018). Volume then drops sharply on the 2nd day as family visits intensify, before recovering gradually from Day 3 onward.
Why top downloaded categories diverge from actual holiday screen time
A frequent planning mistake among seasonal media buyers is equating high pre-holiday install volume with active in-holiday ad inventory. APAC Lunar New Year benchmarks from AppFlood Network and InMobi covering 2015–2017 (pages 8–9) show a sharp split between newly installed categories and categories where users actually spend their time:
| APAC Holiday Rank (AppFlood, InMobi) | By New App Downloads | By Active Time Spent During Tet | Media & Monetization Implication |
|---|---|---|---|
| Rank 1 | Productivity (42% of total downloads) | Music & Video Entertainment | Users install utilities pre-holiday, then stream media during the break |
| Rank 2 | Tools & Utility | Arcade Games (Angry Birds, Sonic) | Casual/arcade sessions supply dense in-app ad impressions |
| Rank 3 | Casual Games | Social & Communication | Core channel for holiday social sharing and messaging reach |
| Rank 4 | Social & Communication | Casual Games | Sustains multi-day repeat sessions across the week-long break |
| Ranks 5 – 6 | Card Games (APAC storefront category) | Photography (Rank 5) & Tools/Utility (Rank 6) | Camera and photo-editing usage rises during holiday outings |
Productivity apps (calendars, cloud storage, office suites) capture 42% of total Lunar New Year downloads as users organize schedules for the year ahead, yet drop out of the top six categories for active holiday time spent. Brands seeking high impression volume during the seven-day break must buy inventory across Music & Video apps, Arcade and Casual games, and Social & Communication platforms.
How do holiday in-app ad budgets and eCPMs vary across verticals, device tiers, and formats?
Part 02 examines how non-gaming brand budgets distribute across mobile app environments and how hardware and ad formats shape publisher yield. According to Smaato's 2017–2018 APAC holiday data (page 11, excluding gaming and app-install ad budgets), brand spending concentrates across Game, Social, and News apps across six advertiser verticals: Retail, Food & Beverage (F&B), Healthcare, Media, Automotive, and Others.
- Retail dominates cross-category spend: Retail advertisers represent the single largest spending vertical inside Social apps and rank second in ad spend across both Game and News apps.
- F&B maintains broad holiday presence: Food and beverage brands invest substantially across all three app environments to capture festive dining and gifting demand.
- Healthcare targets editorial context: Healthcare products and services account for 23% of mobile ad spending inside News apps, compared with only 4% inside Game apps.
How Retail and consumer verticals continued scaling digital budgets across Vietnam is detailed further in Adsota's 2019 Vietnam digital advertising market report.
Budget Android's 49% impression share versus iOS's 153X eCPM premium
Splitting programmatic traffic across Budget (low-end to mid-range) Android, High-End Android, and iOS devices uncovers an inverse relationship between impression volume and monetization yield according to 2017–2018 Smaato and InMobi benchmarks (pages 12–13).
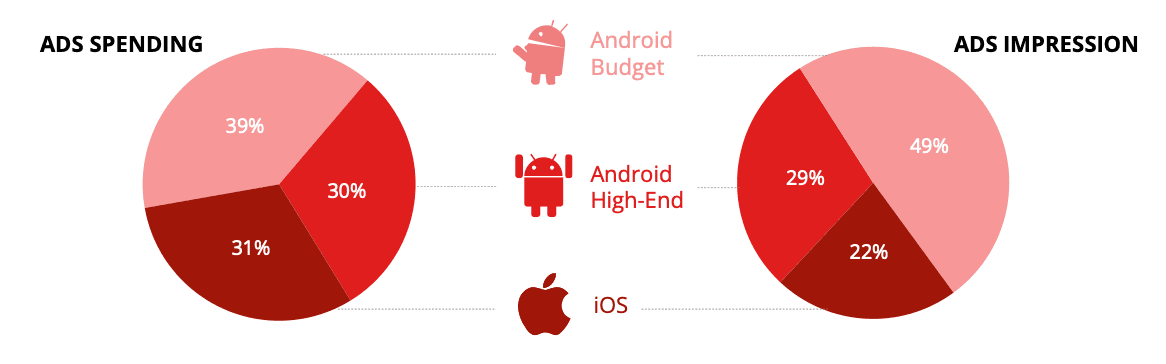
Smaato and InMobi's device breakdown shows Budget Android generating nearly half of all ad impressions, while iOS captures disproportionate advertiser spend per impression:
| Device Segment (Smaato, InMobi 2017–2018) | Share of In-App Ad Spend | Share of Ad Impressions | Indexed In-App Revenue (eCPM) |
|---|---|---|---|
| Budget Android (Low- to Mid-Range) | 39% | 49% | 100X (baseline) |
| High-End Android | 30% | 29% | 134X (+34% vs. Budget Android) |
| iOS (iPhone, iPad) | 31% | 22% | 153X (+53% vs. Budget Android) |
Advertisers allocate 39% of budgets to Budget Android devices to secure 49% of total impressions. Conversely, iOS accounts for just 22% of impressions yet attracts 31% of spending. Across all tiers, Smaato reports that iOS produces 30% higher overall in-app eCPM than Android, while High-End Android still delivers a meaningful 134X premium over low-end handsets.
In-app ad format eCPM hierarchy: Rewarded, Interstitial, Native, and Banner
Ad format architecture drives even steeper yield multiples than device tier. Combined 2017–2018 benchmarks from Appodeal, Google, and Smaato (page 14) establish a clear four-tier revenue ladder:
- Rewarded Ads (Rank 1): Deliver the highest eCPM of all four formats by offering opt-in in-app rewards in exchange for completed views.
- Interstitial Ads (Rank 2): Rank second in profitability, generating 3x the eCPM of Native ads and roughly 5–6x the eCPM of standard Banners.
- Native Ads (Rank 3): Blend into in-app content feeds to produce nearly double the eCPM of Banner placements.
- Banner Ads (Rank 4): Generate the lowest baseline eCPM, serving primarily for low-cost continuous reach.
User receptivity toward rewarded video and optimal ad duration in Vietnam are analyzed further in Appota's 2019 Vietnam mobile marketing and game report.
Why did Vietnam's Lunar New Year eCPM hit 222X and surpass Japan and South Korea?
The report's central monetization finding is Vietnam's dramatic regional eCPM surge during the seven-day Tet holiday. According to Smaato's 2017–2018 APAC tracking (page 15), daily mobile in-app ad requests across the seven days of Lunar New Year rose sharply compared with average January and February days.
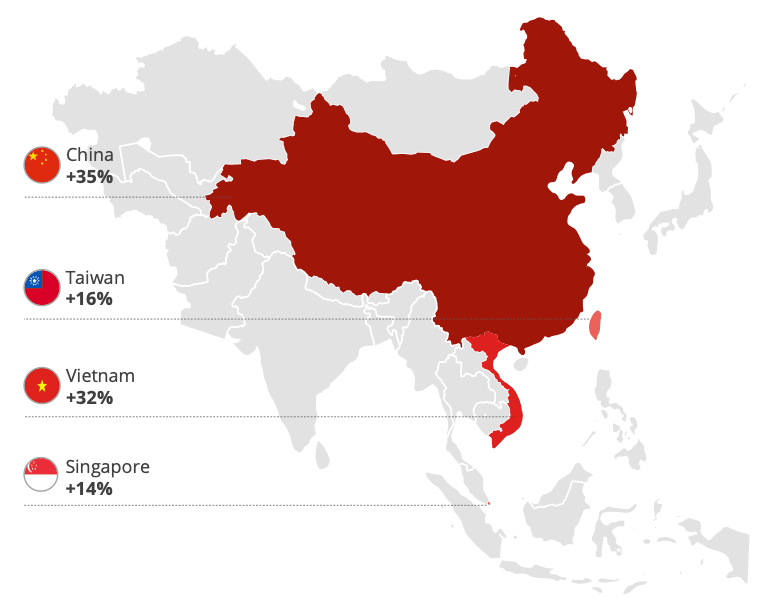
Smaato's regional map highlights how week-long holiday breaks fuel mobile supply: China led APAC with a +35% surge in daily ad requests, followed closely by Vietnam in second place at +32%. Markets with shorter Lunar New Year breaks recorded more moderate lifts at +16% in Taiwan and +14% in Singapore.
Combined with concentrated seasonal brand bidding, that +32% supply expansion propelled Vietnamese publisher yields past East Asia's mature mobile economies. Indexing Lunar New Year eCPMs against Japan = 100X (a non-Lunar-New-Year benchmark market included on the Vietnamese edition's page 16 chart), Appodeal and Smaato (2017–2018) rank seven APAC markets as follows:
| Lunar New Year Rank (Appodeal, Smaato) | APAC Market | Indexed Holiday eCPM | Multiple vs. Japan (100X) |
|---|---|---|---|
| Rank 1 | China | 656X | 6.56x Japan |
| Rank 2 | Singapore | 300X | 3.00x Japan |
| Rank 3 | Philippines | 244X | 2.44x Japan |
| Rank 4 | Vietnam | 222X | 2.22x Japan (+67% vs. South Korea) |
| Rank 5 | Malaysia | 167X | 1.67x Japan |
| Rank 6 | South Korea | 133X | 1.33x Japan |
| Baseline Reference | Japan (does not celebrate Lunar New Year) | 100X | 1.00x baseline |
During non-holiday months (page 22), South Korea averages 166X against Japan's 100X, and both mature markets command higher baseline eCPMs than Southeast Asia. During the Lunar New Year week, however, Vietnam's indexed eCPM climbs to 222X—more than double Japan (100X) and well ahead of both South Korea (133X) and Malaysia (167X).
Domestic publishers that freeze live operations before Tet forfeit their highest-yielding domestic monetization week of the year. Marketing teams planning end-of-year creative calendars can also review our holiday marketing and customer reconnection report.
Which global markets and international holidays drive revenue for Vietnamese app publishers?
Part 03 addresses Vietnamese app and game studios expanding overseas. Google data from 2017 covering Google Play and iOS exports by Vietnamese publishers (pages 19–20) reveals a stark divergence between top download destinations and top revenue-generating markets:
| Overseas Rank for Vietnamese Apps (Google, 2017) | Top Foreign Markets by Downloads | Top Foreign Markets by Overall Revenue |
|---|---|---|
| Rank 1 | India (13% of overseas downloads) | United States (20% of overseas revenue) |
| Rank 2 | United States (11%) | Australia (5%) |
| Rank 3 | Brazil (8%) | Germany (3%) |
| Rank 4 | Indonesia (6%) | Japan (3%) |
| Rank 5 | Russia, Turkey, Mexico (5% each) | South Korea (3%) |
| Next Tracked Markets | Philippines (3%), Argentina (2%) | Thailand (3%) |
High-population emerging markets led by India (13%), Brazil (8%), and Indonesia (6%) supply large install volumes yet fall outside the top six revenue contributors. By contrast, the United States ranks second in downloads (11%) while generating 20% of all international revenue for Vietnamese publishers—four times second-place Australia (5%) and nearly seven times Germany, Japan, South Korea, or Thailand (3% each).
Christmas Cost-Per-Install benchmarks and the 1,889X US eCPM gap
Targeting Western and APAC markets where Christmas and New Year are official public holidays (the US, Australia, Germany, Brazil, and the Philippines) requires balancing acquisition costs against ad yield. Per 2018 Chartboost benchmarks (page 21), the US posted the world's highest Christmas and New Year Cost Per Install (CPI) at roughly USD 1.50 on Google Play and USD 2.30 on the Apple App Store.
Within Southeast Asia, the Philippines exhibited an unusual platform inversion during Christmas: Android CPI climbed to roughly USD 1.11, whereas iOS CPI remained around just USD 0.30 (cited as under USD 0.50 in the Vietnamese edition). On Chartboost's two-axis scatter plot, Australia and Germany sat in the mid-to-high CPI tier, while Brazil remained below USD 0.25 on both storefronts.
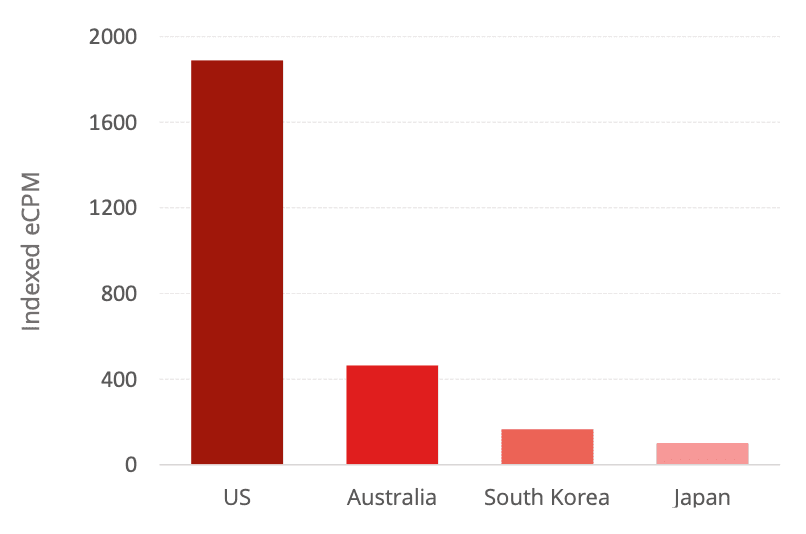
High US acquisition costs are offset by unmatched ad monetization density. Benchmarking four of the six top revenue markets for Vietnamese publishers against a Japan = 100X baseline, Appodeal and Smaato (2017–2018, page 22) record South Korea at 166X, Australia at 464X, and the United States at 1,889X—nearly 18.9 times Japan and over four times Australia.
Super Bowl Sunday and Black Friday monetization spikes in the United States
Because the US anchors 20% of foreign revenue at an average 1,889X eCPM, two bonus slides examine unofficial American holidays that trigger massive programmatic surges according to Smaato (pages 23–24):
- Super Bowl Sunday (first Sunday of February): The National Football League (NFL) championship acts as America's largest unofficial holiday, driving heavy second-screen smartphone activity across messaging, social status updates, and food delivery during the broadcast. On Super Bowl Sunday, US mobile ad spending jumped nearly 300% and publisher eCPM rose 50% over normal days.
- Halloween (October 31) and Black Friday (November 24): Late-year retail campaigns lift US indexed eCPMs starting on Halloween (October 31) and peak on Black Friday (measured on November 24, 2017). Daily average US ad spending increased 32% on Black Friday (rendered as a 32–35% eCPM jump in the Vietnamese edition), lifting average US eCPM for the entire month of November by 30% compared with October.
How is Vietnam's programmatic mobile ads ecosystem structured, and what should teams execute?
Pages 25–27 map the local partner landscape across three reference directories compiled by Adsota. The Vietnam Digital Ads Ecosystem groups six segments: Digital Ads Agencies (Adsota, Adtima, Admatic, Admicro, ANTS, Havas, Isobar, Maxus, MediaCom, Adways, AdFlex, CleverAds, Ureka Media, Ecomobi), Social Listening Tools (Buzzmetrics, YouNet Media, SMCC, Radian6…), Social Platforms, Live Streaming Platforms, Multi-Channel Networks (OTA Network, POPS, Yeah1, Metub…), and eCommerce marketplaces (Lazada, Shopee, Tiki, Sendo…).
At the app monetization layer, the Vietnam Mobile Ecosystem and Vietnam Programmatic Mobile Ads Ecosystem organize seven ad-tech stacks: general Ad Networks (AdMob, Facebook Audience Network, DoubleClick, Appodeal, Unity Ads, ironSource, AppLovin, Smaato, MoPub…), Video-Oriented Ad Networks (AdColony, Tapjoy, Chartboost, InMobi, Vungle), Ad Mediation layers, Ad Exchanges (led locally by AppotaX on Google Ad Exchange alongside OpenX, ANTS, MOG, and MoPub), Demand- and Supply-Side Platforms (DSPs and SSPs), and Measurement & Analytics suites (AppsFlyer, Adjust, Kochava, App Annie, Firebase Analytics). Ongoing analyses of performance media and creator monetization appear in our Marketing & Creator insights topic hub.
Advertisers and mobile app publishers can translate Adsota's holiday findings into five concrete operating decisions:
- Decouple pre-Tet user acquisition from in-holiday brand reach: Run app-install campaigns 10–15 days before Tet to capture the 7–10 day pre-holiday download peak, then shift brand impression budgets during the seven-day break into Music & Video, Arcade/Casual games, and Social apps (targeting Tet Day 1 and Day 3 onward).
- Segment bidding and monetization by hardware tier: Use Budget Android (49% of impressions at 100X eCPM) for broad reach efficiency, while isolating iOS (153X eCPM, +30% over Android) and High-End Android (134X) for high-margin conversions and premium ad placements.
- Prioritize Rewarded and Interstitial inventory during holiday surges: Anchor monetization around opt-in Rewarded placements and natural-break Interstitials (5–6x Banner eCPM) to capture Vietnam's +32% Tet ad request surge and 222X eCPM window.
- Balance global scale markets against high-eCPM revenue anchors: Pair low-CPI volume markets such as India (13% of downloads) and Brazil (8%) with Tier-1 monetization anchors led by the US (20% of revenue, 1,889X eCPM) and Australia (5% of revenue, 464X eCPM), while exploiting platform pricing anomalies like low Christmas iOS CPIs in the Philippines.
- Ship US mediation and live-ops updates ahead of unofficial holidays: Lock SDK mediation waterfalls and seasonal placements before the first Sunday of February (Super Bowl: +300% spend, +50% eCPM) and ahead of the October 31 – November 24 retail window (Black Friday: +30% November eCPM over October).
Complete the download form on this page to access the full 29-page Vietnam Mobile Advertising and App Monetization Report — Holiday Season 2018 PDF from Adsota, including high-resolution Vietnam Digital Ads, Mobile, and Programmatic Mobile Ads ecosystem maps.
Sources
- Báo cáo Quảng cáo di động & Tình hình App Monetization Việt Nam — Số đặc biệt Mùa lễ hội 2018 (Vietnam Mobile Advertising & App Monetization Report - Holiday Season 2018), Công ty Cổ phần Adsota (trực thuộc Appota Group), 2019-01-22, accessed 2026-10-31
- Digital in 2018: Vietnam — Mobile, Smartphone & Social Mobile Penetration, We Are Social, Google & Nielsen, 2018-01-30, accessed 2026-10-31
- Vietnam Daily App Store Downloads — Lunar New Year 2017 & 2018, App Annie (data.ai), 2018-03-15, accessed 2026-10-31
- APAC Lunar New Year Mobile App Downloads & Time Usage by Category (2015–2017), AppFlood Network & InMobi, 2018-01-15, accessed 2026-10-31
- Global & APAC Holiday In-App Advertising Trends — Spending by Category, Device Tier, Ad Requests & US Unofficial Holidays, Smaato & InMobi, 2018-02-20, accessed 2026-10-31
- Mobile In-App eCPM Index by Ad Format and Country Markets (2017–2018), Appodeal, Google & Smaato, 2018-04-10, accessed 2026-10-31
- Top Foreign Markets for Vietnamese Mobile App Publishers by Downloads & Overall Revenue, Google, 2017-12-01, accessed 2026-10-31
- Holiday Season (Christmas & New Year) Global Cost-Per-Install Benchmarks, Chartboost, 2018-12-01, accessed 2026-10-31
- Bản đồ Hệ sinh thái Quảng cáo số, Di động & Programmatic Mobile Ads tại Việt Nam (2018), Công ty Cổ phần Adsota (Appota Group), 2019-01-22, accessed 2026-10-31