
Vietnam Mobile Report Q2 2017: 4G, E-Commerce, and Gaming
Appota's Vietnam Mobile Report Q2 2017 synthesizes telemetry from over 30 million platform users and a 1,000-adult survey across Hanoi and Ho Chi Minh City. Vietnam reached 48 million smartphones, 3.5 million active 4G users, a 4.8% mobile shopping app conversion rate, and an 85.7% game share among Google Play Top Grossing apps.
Analysis from Appota's Vietnam Mobile Report Q2 2017: 3.5M active 4G users, 48M smartphones (67% Android, 29% iOS), 4.8% shopping app conversion, gaming trends, and CPI benchmarks.
Key findings
- 3.5M 4G & 52% ViettelBy Q2 2017, Vietnam recorded 6.3 million registered 4G subscribers and 3.5 million active 4G users nationwide, with 88% residing in Hanoi and Ho Chi Minh City and 58% satisfied with service quality; Viettel led 4G market share at 52%, ahead of MobiFone (27%) and VinaPhone (21%) (IDG Vietnam, ICTnews).
- 17X game video & 5M ShopeeSummer school holidays drove YouTube gaming watch time in Vietnam (especially online games and eSports) to 17 times the watch time of sports content; meanwhile, Garena-backed Shopee reached 5 million app downloads after 1 year as Vietnam's e-commerce market was projected to reach USD 2.08 billion in 2017 (Appota, Shopee).
- 48M smartphones & 67% AndroidAcross a population of 93 million, over 50 million Internet users, and 130 million mobile subscriptions, smartphone penetration in Vietnam reached 55% (~48 million devices); Android held 67% of the mobile OS market, iOS captured 29%, and other operating systems accounted for 4% (MIC, VNPT, Internet World Stats).
- 47.61% Samsung & 23.15% OppoOver 90% of smartphone shipments in Vietnam in early 2017 ran Android (with iPhones at roughly 8% of unit shipments) as consumers favored VND 2–3 million (USD 88–130) entry-level handsets; by H1 2017 revenue share, Samsung led with 47.61%, followed by Oppo (23.15%), Apple (8.88%), and Mobiistar (2.96%), while the Oppo F1s 2017 ranked as the #1 best-selling model (GfK).
- 95% social & 82.1% gamingVietnamese users averaged 6 hours 53 minutes daily on the Internet via PC/tablet, 2 hours 33 minutes via mobile phone, and 2 hours 38 minutes on social media, led by Facebook (51%), YouTube (51%), FB Messenger (37%), Google+ (32%), and Zalo (30%) (We Are Social 2017); on smartphones, 95% of surveyed adults used social networks, 82.1% played games, and 80.6% watched movies or clips (Appota).
- 4.8% conversion & 7.9m in AppOn Lazada Vietnam (May 10, 2017), the mobile shopping app averaged 400,000 daily sessions, a 4.8% conversion rate, and 7.9 minutes per session, far outperforming mobile web at 290,000 daily sessions, 1.5% conversion, and 2.2 minutes per session; in the prior 3 months, 56.1% of surveyed buyers shopped on Lazada, 50% on Facebook shopping, 23.5% on Shopee, and 83.2% spent under VND 1,000,000 per order (Lazada, Appota).
- 26% Action & 24.5% MOBADuring the first 6 months of 2017, Action led mobile game downloads at 26%, followed by Casual (19%), Arcade (14%), Puzzle (8%), and Racing (5%); by active monthly player reach in Hanoi and Ho Chi Minh City, Casual led at 38%, followed by MOBA (24.5%), Sport (12.2%), Shooter (11.2%), Role playing (9.7%), and Card games (3.6%) (Appota).
- 85.7% Grossing & $0.27–$1.06 CPIGames accounted for 85.7% of Top Grossing apps on Google Play and 49.8% on the Apple App Store (Applyzer); average mobile game CPI in Vietnam ranged from ~$0.27 to ~$1.06, with iOS exceeding Google Play across 12 of 14 genres (peaking in Sports at ~$1.06 and Casino at ~$1.04), whereas Educational (~$0.70 vs. ~$0.54) and Family & Board (~$0.65 vs. ~$0.61) cost more on Google Play (Chartboost).
Which Five Developments Defined the Vietnam Mobile Report in Q2 2017?
Released on August 18, 2017 by Appota Group, the Vietnam Mobile Report for Q2 2017 (Enjoy the Mobile Summer Time 2Q-17) examines how nationwide 4G deployment and the summer break reshaped digital consumption. Spanning 26 slides, the study combines operational telemetry from Appota's 30-million-user platform and a random survey of 1,000 adults in Hanoi and Ho Chi Minh City with data from Vietnam's Ministry of Information and Communications (MIC), VNPT, IDG Vietnam, GfK, We Are Social, Lazada, Chartboost, and Applyzer.
On slide 2, the presentation organizes its market analysis around five pillars: Trending, Device, User behavior, Game Market, and Advertisements. Readers following our Gaming research can pair this quarterly benchmark with the Vietnam Mobile App Market Report H1 2018 to trace how 2017's 4G expansion evolved into 2018's mobile eSports and fintech boom.
Nationwide 4G Reaches 3.5 Million Active Users as YouTube Gaming Watch Time Hits 17X Sports
Chapter 1 (Top 5 Events in Quarter 2, slides 3–8) highlights five commercial and regulatory milestones across telecommunications, digital video, e-commerce, and subscriber registration:
- 4G commercial rollout reaches 3.5 million active users (slide 4): According to an IDG Vietnam report, Vietnam recorded 3.5 million active 4G subscribers nationwide by Q2 2017. Roughly 88% of those 4G users lived in Hanoi and Ho Chi Minh City, and 58% expressed satisfaction with 4G service quality.
- Summer break pushes YouTube gaming watch time to 17X sports content (slide 5): School holidays gave students significantly more leisure time for gaming and video streaming. On YouTube in Vietnam, watch time for gaming content — led by online games and eSports — ran 17 times higher (
17X) than watch time for traditional sports content. - Shopee reaches 5 million app downloads after one year in Vietnam (slide 6): Shopee, the mobile marketplace founded by Singaporean tech company Garena (Sea Group), claimed 5 million app downloads after its first year in Vietnam. The report notes that Vietnam's broader e-commerce market was projected to reach USD 2.08 billion in 2017.
| Q2 2017 Market Milestone | Organizations Involved | Key Metric Reported | Ecosystem Impact (Slide) |
|---|---|---|---|
| 4G commercial boom | IDG Vietnam, Viettel, MobiFone, VinaPhone | 3.5M active 4G users; 88% in HN & HCMC; 58% satisfied | Enables low-latency mobile eSports and HD video streaming (slide 4) |
| Summer gaming video surge | YouTube Vietnam, eSports publishers | Gaming watch time reaches 17X (17X) sports content |
Elevates gaming creators and video ad inventory (slide 5) |
| Mobile marketplace expansion | Shopee (Garena), Vietnam e-commerce sector | 5M Shopee app downloads in 1 year; USD 2.08B market | Accelerates app-first C2C and B2C mobile shopping (slide 6) |
| OTT broadcast copyright rules | VTV, VTVGo, FPT Play, ClipTV, VNPT Media | VTV halts third-party internet retransmission pending DRM | Intensifies competition among licensed OTT TV apps (slide 7) |
| Prepaid SIM photo ID mandate | MIC, mobile telecom carriers | Millions of daily spam SMS from unverified prepaid SIMs | Enforces portrait photo verification for new/unverified SIMs (slide 8) |
VTV Tightens OTT Broadcast Copyright and Telecom Regulators Enforce Subscriber Photo IDs
Slides 7 and 8 examine two regulatory shifts affecting OTT media platforms and mobile user onboarding:
- Vietnam Television (VTV) requires OTT providers to comply with copyright law (slide 7): National broadcaster VTV announced it was not yet ready to distribute VTV-produced television channels across third-party internet platforms while evaluating technical copyright-protection solutions. The decision directly impacted major OTT providers and intensified competition among VTVGo, FPT Play, ClipTV, and VNPT Media.
- Mobile subscribers react to new photo ID registration rules (slide 8): Under updated telecom regulations (Decree 49/2017/ND-CP), new subscribers and existing users with incomplete records were required to submit portrait photos alongside ID documents. Official data cited on slide 8 showed that millions of spam SMS messages were sent daily in Vietnam, originating mostly from unregistered or falsely registered prepaid accounts.
How Did 3G/4G Infrastructure, OS Share, and 16 Smartphone Vendors Split in Q2 2017?
Opening Chapter 2 (Vietnam Mobile Ecosystem in Q2, slides 9–12), the report quantifies national connectivity, operating system distribution, and smartphone retail revenue across the first half of 2017.
48 Million Smartphones, 67% Android Share, and Viettel's 52% Lead in 4G Subscriptions
On slide 10, statistics from MIC, VNPT, and Internet World Stats establish four macro connectivity indicators for Vietnam in Q2 2017:
- Population: 93 million (
93M). - Internet Users: Over 50 million (
50M+, exceeding 53.8% of the population). - Mobile Subscriptions: 130 million (
130M, or 1.4 SIM connections per resident). - Smartphone Penetration: 55%, representing approximately 48 million active devices (
~48M devices).
In the accompanying donut chart (Mobile OS Market Share in Vietnam, slide 10), Android captured 67% of active smartphones, iOS held 29%, and Other operating systems accounted for 4%. With legacy platforms shrinking to 4%, mobile product teams could focus engineering almost exclusively on Android and iOS.
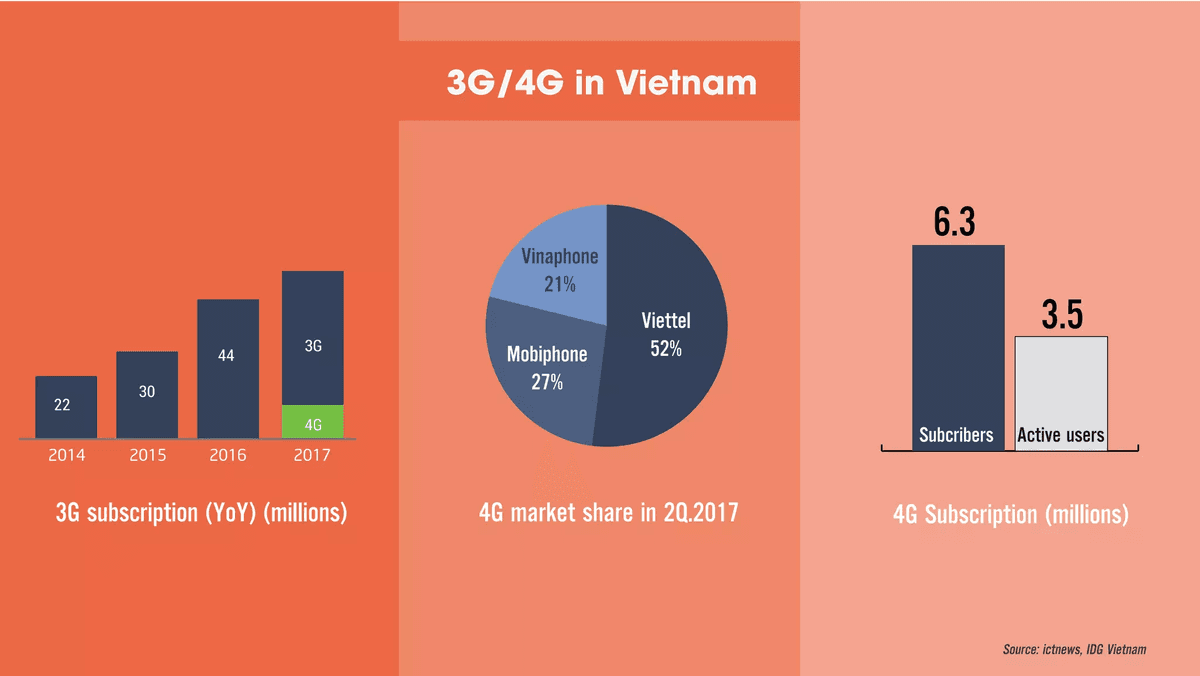
On slide 11 (3G/4G in Vietnam), figures from ICTnews and IDG Vietnam track the transition from 3G to 4G:
- Multi-year 3G subscription growth: Active 3G subscriptions expanded from 22 million in 2014 to 30 million in 2015 (+36.4% YoY) and 44 million in 2016 (+46.7% YoY), continuing to grow alongside initial 4G adoption in 2017.
- Registered vs. active 4G gap: By Q2 2017, Vietnam recorded 6.3 million registered 4G subscribers (Subscribers) and 3.5 million active 4G users (Active users, an active utilization rate of 55.6%).
- Q2 2017 4G carrier market share: Viettel captured 52% of the 4G market, followed by MobiFone at 27% and VinaPhone at 21%.
Android Exceeds 90% of Shipments as Samsung Claims 47.61% of Revenue and Oppo F1s Tops Sales
On slide 12 (Smartphone shipments & Best Mobile Purchase in first 6 months of 2017), May 2017 retail tracking from GfK (printed as JFK (May, 2017) on the slide) shows that more than 90% of smartphone unit shipments in early 2017 ran Android, while iPhones accounted for only 8% of unit shipments. Vietnamese consumers continued to favor entry-level handsets priced between VND 2 million (USD 88) and VND 3 million (USD 130).
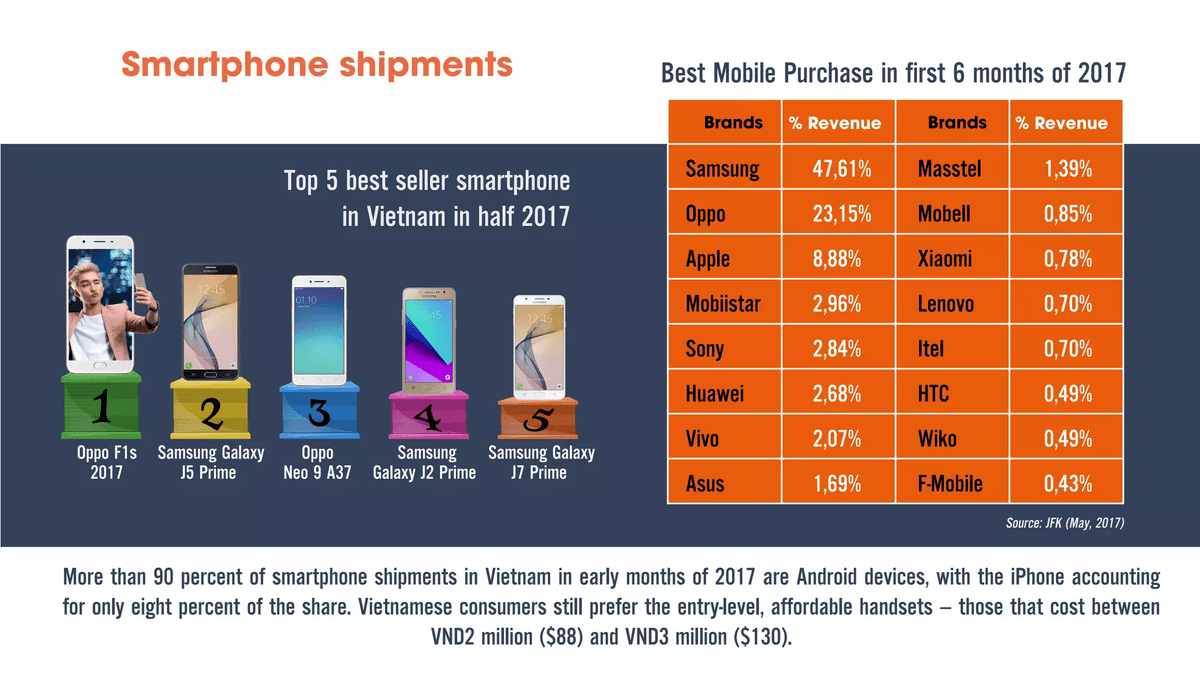
All five of Vietnam's best-selling smartphone models in the first half of 2017 came from Oppo and Samsung:
- Rank 1: Oppo F1s 2017
- Rank 2: Samsung Galaxy J5 Prime
- Rank 3: Oppo Neo 9 A37
- Rank 4: Samsung Galaxy J2 Prime
- Rank 5: Samsung Galaxy J7 Prime
| Rank | Smartphone Brand (Col. 1) | H1 2017 Revenue Share | Rank | Smartphone Brand (Col. 2) | H1 2017 Revenue Share |
|---|---|---|---|---|---|
| 1 | Samsung | 47.61% | 9 | Masstel | 1.39% |
| 2 | Oppo | 23.15% | 10 | Mobell | 0.85% |
| 3 | Apple | 8.88% | 11 | Xiaomi | 0.78% |
| 4 | Mobiistar | 2.96% | 12 | Lenovo | 0.70% |
| 5 | Sony | 2.84% | 13 | Itel | 0.70% |
| 6 | Huawei | 2.68% | 14 | HTC | 0.49% |
| 7 | Vivo | 2.07% | 15 | Wiko | 0.49% |
| 8 | Asus | 1.69% | 16 | F-Mobile | 0.43% |
Across the 16 vendors listed on slide 12, Samsung (47.61%) and Oppo (23.15%) generated 70.76% of total retail smartphone revenue, while Apple ranked third at 8.88%. Four domestic Vietnamese handset brands appeared in the Top 16: Mobiistar (#4 at 2.96%), Masstel (#9 at 1.39%), Mobell (#10 at 0.85%), and F-Mobile (#16 at 0.43%).
How Did Vietnamese Users Split Daily Media Time, Social Platforms, and Hourly Impressions?
Slides 13 through 16 combine We Are Social 2017 benchmarks with Appota's survey of 1,000 randomly selected adults in Hanoi and Ho Chi Minh City to map daily digital behavior.
2 Hours 33 Minutes of Daily Mobile Internet Use alongside 95% Social and 82.1% Gaming Reach
Per We Are Social 2017 on slide 13, average daily media consumption in Vietnam split across four channels:
- Internet via PC or Tablet: 6 hours 53 minutes (
6h53m). - Social media via any device: 2 hours 38 minutes (
2h38m). - Internet via mobile phone: 2 hours 33 minutes (
2h33m). - Television viewing time: 1 hour 26 minutes (
1h26m, barely half the time spent on mobile Internet).
On slide 14, the survey of 1,000 adults in Hanoi and Ho Chi Minh City ranked the top six activities performed on smartphones:
- Social network: 95.0% (
95%) - Play game: 82.1%
- Watch movie, clip: 80.6%
- Search information: 67.3%
- Read news: 62.2%
- Check mail: 42.3%
| Platform (Slide 16) | Category Classification | Active Usage (%) | Platform (Slide 16) | Category Classification | Active Usage (%) |
|---|---|---|---|---|---|
| Social Network | 51% | Social Network | 22% | ||
| YouTube | Social Network | 51% | Skype | Messenger / Chat / VOIP | 21% |
| FB Messenger | Messenger / Chat / VOIP | 37% | Viber | Messenger / Chat / VOIP | 18% |
| Google+ | Social Network | 32% | Social Network | 14% | |
Zalo (printed Zalo+) |
Messenger / Chat / VOIP | 30% | Messenger / Chat / VOIP | 13% | |
| Social Network | 22% | LINE | Messenger / Chat / VOIP | 12% |
Hourly Ad Impression Curves Across Devices and the Dominance of Facebook, YouTube, and Zalo
On slide 15 (Impression by device through a daily time), hourly impression curves across Phone, Desktop, and Tablet reveal distinct daypart windows:
- Phone: Rises sharply during Early Morning (
7am - 10am), holds steady across Daytime (10am - 5pm, misprinted as10am - 5amon the axis), climbs through Late Afternoon (5pm - 8pm), and peaks during Prime Time (8pm - 12am). - Desktop: Leads relative impression share during daytime working hours (10:00 to 17:00), then drops off in the evening.
- Tablet: Remains low during working hours before surging after 17:00 to reach the sharpest relative concentration peak during Prime Time (
8pm - 12am).
Among the 12 most active social and messaging platforms tracked by We Are Social 2017 (slide 16), Facebook and YouTube tied for first place at 51%. Within the Messenger/Chat App/VOIP segment, FB Messenger led at 37%, followed closely by homegrown Vietnamese chat platform Zalo at 30%, well ahead of Skype (21%), Viber (18%), WeChat (13%), and LINE (12%).
Why Did Mobile Shopping Apps Achieve a 4.8% Conversion Rate — 3.2X Higher Than Mobile Web?
Slides 17 through 20 analyze mobile e-commerce performance using operational telemetry from Lazada Vietnam (dated May 10, 2017) alongside survey data from 1,000 adults in Hanoi and Ho Chi Minh City.
Mobile Shopping Apps Generate 400k Daily Sessions, 7.9-Minute Visits, and All-Day Sales Leads
E-commerce merchants entering Vietnam often prioritize mobile web traffic before investing in dedicated native apps. However, Lazada Vietnam telemetry from May 10, 2017 (slide 17) demonstrates that native mobile apps outperformed mobile web across every funnel metric:
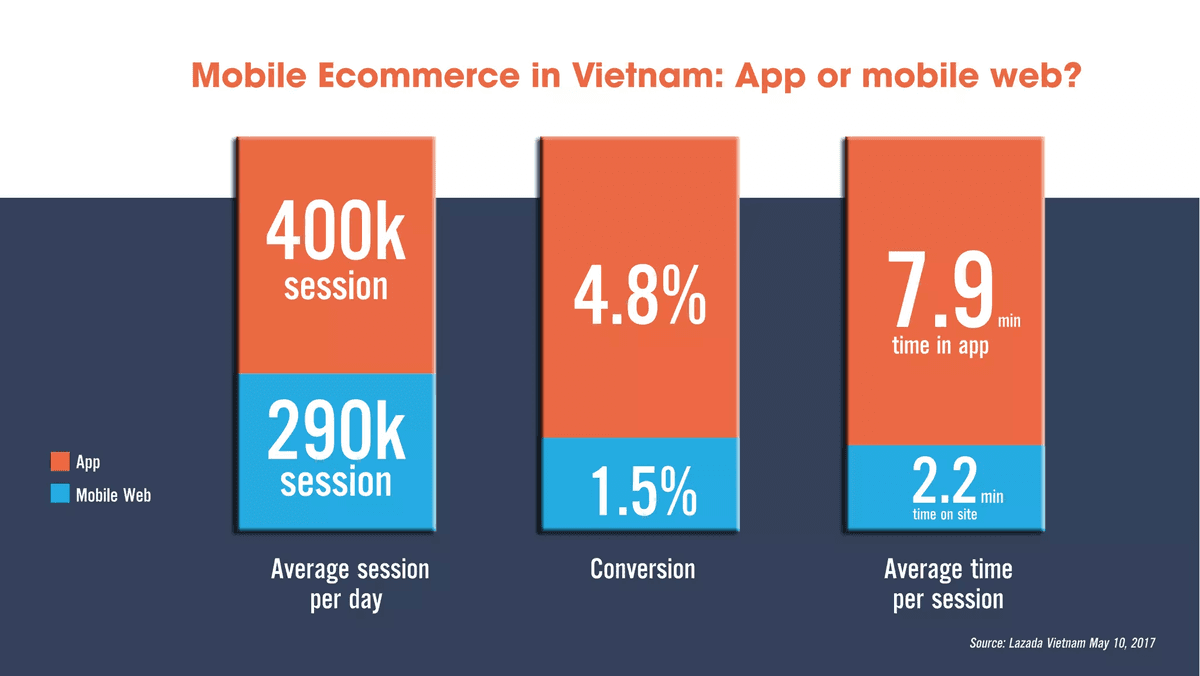
- Average sessions per day: The mobile App generated 400,000 daily sessions (
400k session), 1.38X higher than the 290,000 daily sessions (290k session) on Mobile Web. - Conversion rate: The mobile App converted at 4.8%, 3.2X higher than the 1.5% conversion rate on Mobile Web.
- Average time per session: Users spent 7.9 minutes inside the App (
time in app), 3.59X longer than the 2.2 minutes spent on Mobile Web (time on site).
On slide 18 (Sales per day & Sales per hour: Mobile vs PC), Mobile sales outperformed PC sales across all 7 days of the week (peaking on Tuesday, while PC sales dropped noticeably on Saturday and Sunday). Across all 24 hours of the day, Mobile sales stayed above PC sales, forming two primary buying peaks: a midday peak between 12:00 and 13:00 and a second evening surge between 21:00 and 22:00 when PC sales remained flat.
Fashion (64%) and Tech (56%) Lead Purchases while 83.2% of Orders Fall Below VND 1 Million
On slides 19 and 20, the survey of 1,000 adults in Hanoi and Ho Chi Minh City details product categories purchased online, platforms used in the past 3 months, and one-time order values:
| E-Commerce Product Category (Slide 19) | Buyer Share (%) | Platform Used (Past 3M) & Order Spend (Slide 20) | Buyer Share (%) |
|---|---|---|---|
| 1. Clothing, footwear, cosmetic | 64% | Platform: Lazada | 56.1% |
| 2. Technology | 56% | Platform: Facebook shopping | 50.0% |
| 3. Home appliance | 49% | Platform: Shopee | 23.5% |
| 4. Book, stationery, flower, gift | 42% | Platform: Lotte.vn / Adayroi / Muachung | 3.1% / 2.6% / 1.0% |
| 5. Train and Air ticket / Food | 34% / 33% | Spend: Below VND 200,000 | 29.6% |
| 6. Movie, concert ticket / Tour & hotel | 22% / 19% | Spend: Below VND 1,000,000 | 53.6% |
| 7. Professional service / Music, Video, Game | 7% / 7% | Spend: Below VND 10,000,000 | 14.3% |
| 8. Spa & Beauty service / Others | 6% / 2% | Spend: Above VND 10,000,000 | 2.5% |
Slide 20 confirms that Lazada (56.1%), Facebook shopping (50%), and Shopee (23.5%) dominated recent 3-month buyer reach, far ahead of Lotte.vn (3.1%), Adayroi (2.6%), and Muachung (1%). By ticket size, 83.2% of shoppers spent under VND 1,000,000 per order (53.6% spent below VND 1,000,000 and 29.6% below VND 200,000), while 14.3% spent below VND 10,000,000 and 2.5% spent above VND 10,000,000. Merchants optimizing checkout flows for these high-frequency mobile orders can reference our payment gateway integration checklist.
What Do Game Genre Shares, Chartboost CPI Benchmarks, and Top Grossing Splits Reveal?
Slides 21 through 26 examine mobile game downloads, monthly active genres, Chartboost CPI benchmarks, Applyzer Top Grossing distributions, and Vietnam's programmatic advertising and mobile ecosystem maps.
Action Claims 26% of Game Downloads While Casual (38%) and MOBA (24.5%) Lead Monthly Players
On slide 21 (Vietnam's mobile game market in 2Q17), the Vietnam Mobile Report compares H1 2017 download share across 15 genres against the genres played in a recent month by 1,000 surveyed adults in Hanoi and Ho Chi Minh City:
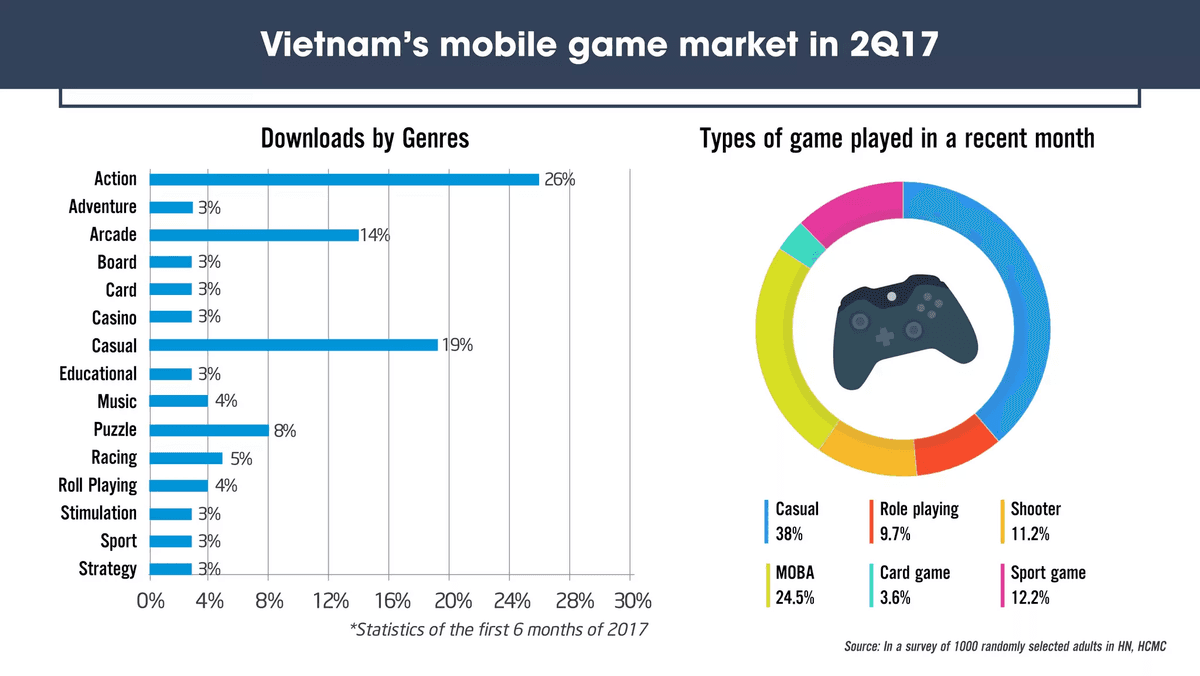
- Downloads by Genres (H1 2017): Action led all genres with 26% of total downloads, followed by Casual (19%) and Arcade (14%). Together, these top three categories accounted for nearly 60% of installs, ahead of Puzzle (8%), Racing (5%), Music (4%), Role Playing (printed
Roll Playing, 4%), and eight genres tied at 3% (Adventure, Board, Card, Casino, Educational, Simulation [printedStimulation], Sport, and Strategy). - Types of game played in a recent month: Casual games ranked first in active monthly reach at 38%, followed by MOBA at 24.5%, Sport games at 12.2%, Shooter titles at 11.2%, Role playing at 9.7%, and Card games at 3.6%. The combined 35.7% monthly reach of MOBA and Shooter titles underpins the 17X YouTube gaming watch-time surge reported on slide 5.
Mobile Game CPI Across 14 Categories and Games' 85.7% Share of Google Play Top Grossing
On slide 22, Chartboost data benchmarks the Average Mobile Game CPI in Vietnam, by Categories across Google Play and iOS for 14 genres. Studios planning mobile game publishing in Vietnam should account for the pricing gap between platforms:
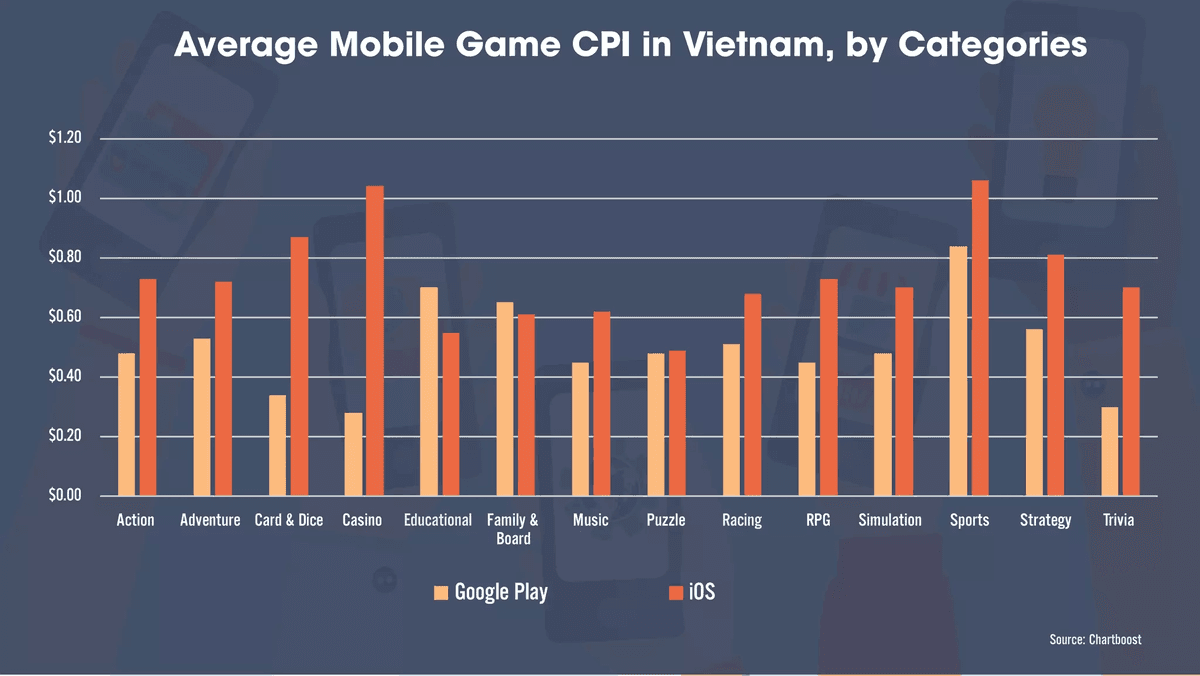
Across Chartboost's 14 categories, iOS CPI was higher than Google Play CPI in 12 genres, surpassing USD 1.00 on iOS in Sports (~$1.06 on iOS vs. ~$0.83 on Google Play) and Casino (~$1.04 on iOS vs. ~$0.27 on Google Play), with wide premiums in Card & Dice (~$0.87 vs. ~$0.33), Strategy (~$0.81 vs. ~$0.56), Action (~$0.73 vs. ~$0.47), RPG (~$0.73 vs. ~$0.44), and Trivia (~$0.70 vs. ~$0.29). Conversely, two family-oriented genres recorded higher CPI on Google Play than on iOS: Educational (~$0.70 on Google Play vs. ~$0.54 on iOS) and Family & Board (~$0.65 vs. ~$0.61), while Puzzle was nearly identical (~$0.47 vs. ~$0.49).
| Game Category (Chartboost, Slide 22) | Google Play CPI (Plotted) | iOS CPI (Plotted) | Top Grossing Category (Applyzer, Slide 23) | Google Play Share | App Store Share |
|---|---|---|---|---|---|
| Sports / Strategy | ~$0.83 / ~$0.56 | ~$1.06 / ~$0.81 | 1. Games | 85.7% | 49.8% |
| Casino / Card & Dice | ~$0.27 / ~$0.33 | ~$1.04 / ~$0.87 | 2. Social / Networking / Communication | 3.6% | 4.8% |
| Action / Adventure | ~$0.47 / ~$0.53 | ~$0.73 / ~$0.72 | 3. Photography | — | 8.1% |
| RPG / Simulation | ~$0.44 / ~$0.47 | ~$0.73 / ~$0.70 | 4. Education | 1.8% | 7.3% |
| Racing / Music | ~$0.51 / ~$0.44 | ~$0.68 / ~$0.62 | 5. Productivity | 1.1% | 5.0% |
| Puzzle / Trivia | ~$0.47 / ~$0.29 | ~$0.49 / ~$0.70 | 6. Tools / Utilities | 1.8% | — |
| Educational / Family & Board | ~$0.70 / ~$0.65 | ~$0.54 / ~$0.61 | Top 5 Listed Categories Combined | 94.0% | 75.0% |
On slide 23 (Top Grossing Apps in Vietnam, by Categories), Applyzer figures show that Games dominated store monetization, representing 85.7% of Top Grossing apps on CH Play (Google Play) and 49.8% on the Apple App Store. Among non-game categories, publishers generated meaningful revenue from Social/Networking/Communication (3.6% on Google Play; 4.8% on App Store), Education (1.8% on Google Play; 7.3% on App Store), and Productivity (1.1% on Google Play; 5.0% on App Store), while Photography apps captured 8.1% of Top Grossing slots on the Apple App Store.
Vietnam's Programmatic Mobile Ads Landscape and Appota's 30-Million-User Ecosystem
Slides 24 through 26 map Vietnam's mobile advertising stack and industry ecosystem in Q2 2017:
- Vietnam programmatic mobile ads ecosystem (slide 24): Organized across 7 technology layers — Ad Networks (Fyber, HeyZap, AppBrain SDK, Appnext, StartApp, Facebook Audience Network, AppLovin, Appodeal, AppsFlyer, AdMob, MoPub, DoubleClick for Publishers, Smaato, Kochava), Ad Mediation (Smaato, OpenX, MoPub, DoubleClick, HeyZap, Mobvista, Appodeal, ironSource, AdMob, Affle), DSPs (Sociomantic, ANTS, Geniee, MicroAd BLADE, Ureka Media), SSPs (ANTS, OpenX, DoubleClick, PubMatic, Rubicon Project, AppNexus), Video-Oriented Ad Networks (AdColony, Tapjoy, Chartboost, Unity Ads, InMobi, Vungle), Ad Exchanges (AppotaX on Google Ad Exchange, DoubleClick, OpenX, ANTS, MOG, MoPub), and Measure & Analytics (AppsFlyer, Adjust, Kochava, App Annie, Google Analytics, TUNE).
- Vietnam Mobile EcoSystem (slide 25): Maps 10 industry verticals including Vietnam Publishers (VNG, Gamota, VTC Game, VTC Mobile, Vega Game, ME Corp, CMN Online, Asiasoft, Hope, Funtap, VTC Online, SohaGame, TeaMobi), Foreign Publishers (Garena, Mobvista, NetEase Games, Koramgame, Gamevil), Social Platforms (Zalo, LINE, Skype, Instagram, Facebook, YouTube), Media (ICTnews, Diễn đàn Doanh nghiệp, VnExpress, CafeF, GameHub.vn, GameK.vn), Carriers (Viettel, VinaPhone, MobiFone, Vietnamobile), Advertising & Marketing (Adsota, Adtima, Admatic, Admicro, Adways, AdFlex, Haravan, CleverAds), Mobile Payment (OnePAY, Smartlink, VTC Pay, Paymentwall, ZaloPay, MoMo, Moca, AppotaPay, OnOnPay, Payoo, BaoKim.vn, 1Pay, SohaPay, NgânLượng.vn), Live Streaming (Facebook, YouTube, TalkTV, Bigo Live), Infrastructure (VCCloud, Tenten.vn, Nhân Hòa, vHost, KDATA, Mắt Bão), and Events (Vietnam Mobile Day, Echelon Vietnam, Khát Vọng Tiên Phong, Techfest, Bluebird Award).
- Appota Group platform footprint (slide 26): By Q2 2017, Appota operated across three core mobile verticals in Vietnam — Game Publishing (Gamota), Advertising (Adsota), and Payment (AppotaPay) — serving more than 30 million users and partnering with over 15,000 developers, advertisers, and merchants worldwide.
Readers can complete the form on this page to download the full 26-slide PDF report published by Appota.
Sources
- Vietnam Mobile Report Quarter 2 - 2017 (Enjoy the Mobile Summer Time 2Q-17), Công ty Cổ phần Appota (Appota Group), 2017-08-18, accessed 2026-11-02
- Vietnam Population, Internet Users, Mobile Subscriptions & Smartphone OS Market Share (Q2 2017), Bộ Thông tin và Truyền thông (MIC), Tập đoàn Bưu chính Viễn thông Việt Nam (VNPT) & Internet World Stats, 2017-06-30, accessed 2026-11-02
- Vietnam 3G/4G Subscriptions, Active Users, Carrier Market Share & User Satisfaction Report (Q2 2017), IDG Vietnam & ICTnews, 2017-07-15, accessed 2026-11-02
- Vietnam Smartphone Shipments, Top 5 Best-Selling Handsets & Brand Revenue Share in H1 2017, GfK Vietnam (ghi nhãn JFK May, 2017 trên trang 12), 2017-05-31, accessed 2026-11-02
- Digital in 2017: Vietnam Daily Media Time Spent & Most Active Social Media Platforms, We Are Social (2017), 2017-01-31, accessed 2026-11-02
- Mobile Ecommerce in Vietnam: App vs. Mobile Web Performance & Daily/Hourly Sales Curve (May 2017), Lazada Vietnam & Garena (Sea Group / Shopee Vietnam), 2017-05-10, accessed 2026-11-02
- Vietnam Mobile Game CPI by Categories & Top Grossing App Store Category Share (Q2 2017), Chartboost & Applyzer, 2017-06-30, accessed 2026-11-02
- Khảo sát 1.000 người trưởng thành tại Hà Nội, TP.HCM và dữ liệu hệ sinh thái Appota Group (Gamota, Adsota, AppotaPay) quý 2/2017, Công ty Cổ phần Appota (Appota Group), 2017-08-18, accessed 2026-11-02