
ReportsCorporate & Digital Economy
Vietnam Mobile App Market Report H1 2018
Appota's H1 2018 report on the mobile app market in Vietnam records 72% smartphone penetration, 42 million mobile Internet users, and an average of 1.7 connected devices per person. Across 60 pages, the study examines the 33-app device lifecycle, e-commerce conversion gaps, the USD 6.14 billion fintech market, mobile game consolidation, and CPI benchmarks.
Comprehensive H1 2018 benchmarks on Vietnam's 3G/4G infrastructure, smartphone market share, app install and churn behavior, mobile e-commerce, fintech, gaming, eSports, and CPI rates.
Key findings
- 72%National smartphone penetration in Vietnam by 2017–2018 (reaching 84% in key cities, 71% in secondary cities, and 68% in rural areas), far surpassing PCs (43%) and tablets (13%), with an average of 1.7 Internet-connected devices per person (Google Consumer Barometer 2017).
- +5 / -3Vietnamese users keep an average of 33 apps installed on their smartphones but open only 8 daily; each month they install 5 new apps and uninstall 3 apps, producing the highest uninstall rate in the Asia-Pacific region (Google Consumer Barometer 2017, Adsota 2017).
- 82%Share of Vietnamese Internet users willing to trade personal information in exchange for free items or promotional rewards from brands, even though 76% state that data privacy is very important (Kantar TNS 2017).
- 1.4% vs 3.6%Mobile phones generate 72% of total visits to e-commerce websites in Vietnam, yet mobile checkout conversion reaches only 1.4% (USD 23 average basket) compared with 3.6% on desktop PCs at a USD 26 basket (iPrice.vn, Q&Me 2017).
- 88% CODShare of e-commerce orders in Vietnam settled via cash-on-delivery (COD), while only 12% use e-banking amid a 42% adult bank account penetration rate (IDG Vietnam 2017, Q&Me 2017).
- USD 6.14BTotal e-payment transaction value in Vietnam at the end of 2017 across 10 million e-wallet users, projected to expand at a 22% compound annual growth rate (CAGR) to reach USD 12.33 billion by 2022 (Statista 2017, CK Finanzpro 2017).
- 21 vs 47During Q1 and Q2 2018, only 21 new mobile games launched in Vietnam while 47 titles shut down; monthly downloads reached 124 million in May 2018 as average revenue per user (ARPU) climbed to USD 0.049 (Statista 2017, Adsota 2018).
- USD 0.15–0.38Average Cost Per Install (CPI) in Vietnam stands at USD 0.15 on Android and USD 0.38 on iOS (versus USD 1.37 and USD 1.67 in Singapore), while total 2017 mobile ad spend reached USD 78 million (eMarketer, IAB Singapore 2017, Adsota 2018, Chartboost 2018).
Demographic momentum and 3G/4G infrastructure driving the mobile app market in Vietnam
Entering the first half of 2018, the mobile app market in Vietnam expanded on the back of a young workforce and strong consumer optimism. According to demographic figures compiled in Appota's report as of June 2018, Vietnam's population reached 96 million, with more than 70% in the working-age bracket, 40% under age 25, and 24% belonging to the Millennial generation. In Q1 2018, The Conference Board recorded Vietnam's Consumer Confidence Index at 124 points, ranking 5th worldwide.
Rapid rollout of mobile broadband networks narrowed the digital access gap between major metropolitan hubs and provincial areas. Data from Euromonitor International (2018), Statista (2018), and Appota (2017) shows 54 million Internet users in Vietnam (over 57% of the population, up 3.42% year-over-year) and 42 million mobile Internet users (45% of the population). Roughly 70% of mobile Internet users subscribed to 3G or 4G data plans at an average connection speed of 14.6 Mbps, placing Vietnam's 4G speed 2nd in Southeast Asia behind Singapore.
| Year | Internet Users (Millions) | Mobile Internet Users (Millions) | Mobile Share of Total Internet Users (%) |
|---|---|---|---|
| 2016 | 52.07 | 42.15 | 80.95% |
| 2017 | 53.86 | 42.18 | 78.31% |
| 2018 (Forecast) | 55.19 | 45.79 | 82.97% |
| 2019 (Forecast) | 56.37 | 48.79 | 86.55% |
| 2020 (Forecast) | 57.49 | 51.38 | 89.37% |
| 2021 (Forecast) | 58.53 | 53.61 | 91.59% |
| 2022 (Forecast) | 59.48 | 55.45 | 93.22% |
Despite broad network coverage, mobile data maturity remained polarized across user segments. Behavioral segmentation across eight Asia-Pacific (APAC) markets by GSMA Intelligence (2017) and AppsFlyer (2017) indicates that more than 50% of mobile subscribers in Vietnam still fell into the "Talkers" segment, relying on handsets primarily for voice calls and SMS. Conversely, about 25% of users belonged to high-intensity digital segments ("Aficionados" and "Pragmatists") who actively engaged in mobile-centric online services, giving Vietnam a higher share of moderate-to-heavy mobile users than India.
Connected device ownership across urban and rural regions
Affordable mid-range handsets more than doubled the average number of Internet-connected devices owned per person within five years. According to Google Consumer Barometer (2017), connected devices per capita in Vietnam rose steadily from 0.8 in 2013 to 1.0 in 2014, 1.4 in 2015, 1.6 in 2016, and 1.7 in 2017. Between 2013 and 2017, national smartphone penetration surged from 20% to 36% (2014), 55% (2015), and stabilized at 72% across 2016–2017, outpacing personal computers (43% in 2017) and tablets (13%).
Broken down by geography in 2017, smartphone ownership in key cities such as Hanoi and Ho Chi Minh City reached 84.0% (climbing from 30% in 2012 at an average annual adoption pace of 6.5%). Secondary cities recorded 71.0% smartphone penetration, while rural areas reached 68.0%. This narrow hardware gap between urban centers and rural provinces created a broad addressable base for digital product teams operating across the corporate and digital economy landscape.
Mobile OS share, Q1 2018 smartphone sales, and app store monetization
Hardware distribution in Vietnam directly shapes product engineering and UI optimization for mobile publishers. Data from StatCounter (2017), Counterpoint Technology Market Research (2017), and BrandsVietnam (2018) shows that Android accounted for 57% of Vietnam's installed mobile OS base at the end of 2017, followed by iOS at 37% and other platforms at 6%. During Q1 2018, 63% of all new smartphones sold nationwide ran on Android.
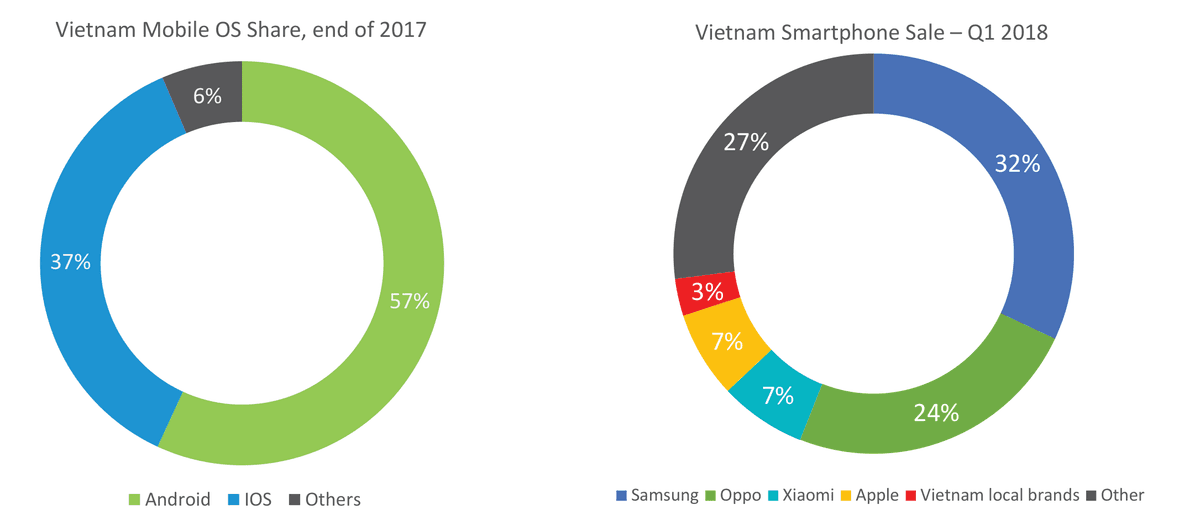
In Q1 2018 smartphone unit sales, Samsung led the market with a 32% share, followed by Oppo at 24%. According to IDC Indochina figures cited in the report, Xiaomi surged to 7% market share (matching Apple at 7%) driven by strong demand for its mid-range Redmi 5 Plus model, while domestic Vietnamese brands held 3% and other manufacturers accounted for 27%. The average purchase price of a smartphone in Vietnam stood at USD 233, underscoring consumer preference for mid-tier devices.
Among Android devices, 2017 telemetry from StatCounter and Counterpoint shows that 720x1280 was the most common screen resolution at 20.65%, ahead of 1080x1920 (13.10%), 480x800 (10.15%), 540x960 (8.08%), 720x1184 (7.71%), and 480x854 (5.68%). Higher-density displays such as 1080x1776 (4.07%) and 1440x2560 (3.30%) represented a small fraction of active devices, requiring developers to optimize package sizes and rendering performance for standard HD and Full HD screens.
Publisher counts and Top Grossing revenue across App Store and Google Play
Store intelligence from Applyzer (2017) highlights a sharp structural contrast between the two storefronts: Google Play hosted 820 active publishers in Vietnam, nearly triple the 279 active publishers on the Apple App Store. In Top Grossing revenue distribution, Games dominated Google Play at 86.80% (followed by Education at 1.80%, Social at 1.70%, Tools at 1.70%, and Productivity at 1.70%). On the Apple App Store, consumer spending was spread across a wider mix of categories, led by Games (33.4%), Entertainment (10.9%), Photography (7.6%), Shopping (6.6%), Utilities (5.5%), Social/Networking (4.6%), Music (4.5%), and Finance (3.0%).
| App Store Category | Share of Top Grossing Revenue on Apple App Store (%) | Share of Top Grossing Revenue on Google Play (%) |
|---|---|---|
| Games | 33.4% | 86.80% |
| Entertainment | 10.9% | 1.30% |
| Photography / Beauty | 7.6% | 0.80% |
| Shopping | 6.6% | — |
| Utilities / Tools | 5.5% | 1.70% |
| Social / Networking | 4.6% | 1.70% |
| Music & Audio | 4.5% | 0.90% |
| Education | 2.7% | 1.80% |
| Productivity | 2.0% | 1.70% |
Smartphone user habits: multi-screen routines, privacy trade-offs, and app churn
Smartphones serve as the primary daily screen for Vietnamese consumers from waking hours until bedtime. According to Google Consumer Barometer (2017), 68% of connected Vietnamese went online via smartphone more often than via PC or tablet; 16% used both equally, and only 9% favored computers or tablets. Meanwhile, multi-screen usage expanded rapidly: single-screen users declined from a 2015 peak of 40% to 35% in 2017, whereas two-screen users doubled from 15% (2013) to 32% (2017) and three-screen users rose from 2% to 9%.
Surveys by Google Consumer Barometer (2017) and DI-Marketing (2017) reveal that Vietnamese users spent over 2 hours per day on their phones. Within 5 minutes of waking up, 46% checked their smartphones (25% immediately and 21% within 5 minutes, plus another 29% within 15 minutes). Female users reached for their handsets faster than male users in the morning, with 50% of women using their phones within 5 minutes of waking (30% immediately, 20% within 5 minutes) compared with 43% of men (21% immediately, 22% within 5 minutes).
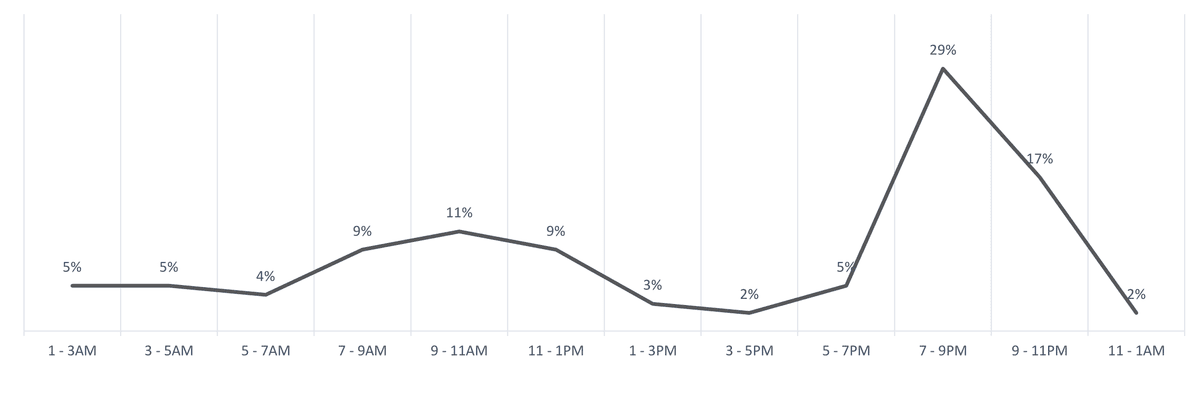
Across the 24-hour cycle, smartphone traffic followed a twin-peak curve aligned with meal breaks and evening family hours. Daytime usage peaked between 9–11 AM (11%, flanked by 9% each during 7–9 AM and 11 AM–1 PM) before dipping to 2%–3% in the afternoon. Activity surged to its highest daily peak between 7–9 PM (29%) and remained elevated between 9–11 PM (17%). Among daily activities, social networking led at 89%, followed by VoIP/OTT calling and texting (75%), taking photos (75%), web browsing (73%), listening to music or watching video (69%), checking email (64%), playing games (61%), shopping (50%), and e-banking (39%).
The data privacy paradox and APAC-leading app uninstall rates
Findings from Google Consumer Barometer (2017) and Kantar TNS (2017) expose a striking behavioral paradox around digital privacy. While 85% of respondents searched the Internet whenever they needed information, 74% found online activities enjoyable, 63% preferred completing tasks digitally, and 54% trusted international brands (2nd highest in APAC). Yet even though 76% stated that personal data protection was very important, 82% were willing to trade personal information in exchange for free items or promotional rewards from brands.
A frequent misconception among new entrants to the mobile app market in Vietnam is equating brisk download volume with long-term retention. In reality, telemetry from Google Consumer Barometer (2017) and Adsota (2017) shows that while an average smartphone in Vietnam held 33 installed apps, users opened only 8 apps daily (8 occasionally, 8 rarely, 4 abandoned, and 5 never opened after installation).
Vietnamese consumers installed an average of 5 new apps per month — the highest adoption rate in APAC (led by Games at 69%, Social Networking at 68%, Messaging at 66%, Media & Entertainment at 63%, and Search at 62%). At the same time, users uninstalled an average of 3 apps per month, giving Vietnam the highest uninstall rate in APAC. Churn was highest in Games (58%), Books, comics & magazines (46%), Shopping & e-commerce (43%), Lifestyle (43%), and Education (41%). How retention dynamics evolved over the subsequent two years is detailed in the Vietnam mobile and smartphone application report for H1 2020.
Mobile e-commerce: why does 72% mobile traffic yield a 1.4% conversion rate?
E-commerce captured strong top-of-funnel growth from Vietnam's smartphone boom. According to Q&Me (2017) and Statista (2017), Vietnam's online shopping base reached 35.1 million consumers in 2017 with total revenue exceeding USD 2 billion, and was forecast to expand to 43.9 million shoppers and over USD 4 billion in revenue. Social commerce via Facebook also surged, with 83% of mobile Internet users buying or selling through Facebook in 2017, up from 67% in 2016.
Demographic data from Q&Me (2017) and Appota (2017) shows that Millennials aged 18–35 accounted for 82% of online shoppers (34% aged 18–25, 30% aged 26–30, 18% aged 31–35, 15% over 35, and 3% under 18). Geographically, Ho Chi Minh City represented 38% of shoppers and Hanoi accounted for 17%, alongside Can Tho (3%), Da Nang (3%), Hai Phong (1%), and rural areas (39%).
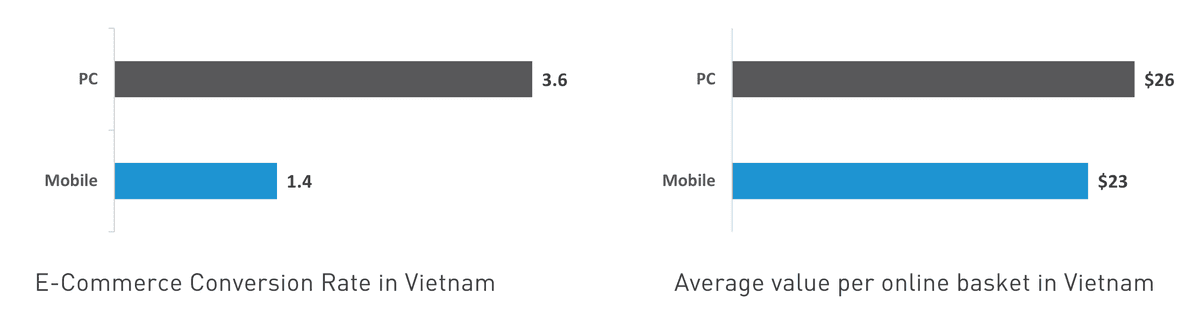
While handsets dominated discovery, benchmark data from iPrice.vn and Q&Me (2017) reveals a pronounced checkout bottleneck on mobile screens. In 2017, 72% of total visits to e-commerce websites in Vietnam originated from mobile phones, up 26% year-over-year (though still trailing Indonesia at ~87%, Thailand, the Philippines, Singapore, and Malaysia in Q2 2017).
Some 53% of online shoppers purchased via mobile browsers (+6%) and 52% used mobile shopping apps (+12%). However, the e-commerce conversion rate on mobile phones reached just 1.4% with an average basket size of USD 23, compared with a 3.6% conversion rate and USD 26 basket size on desktop PCs. Shoppers routinely browsed catalogs on smartphones before switching to a PC to finalize orders.
Shift toward B2C marketplaces and the 88% cash-on-delivery barrier
Consumer migration toward curated marketplaces with stronger buyer protection is evident in web traffic tracked between April and November 2017 by ecommerceIQ (2017) and SimilarWeb (2017). Monthly visits to B2C platforms climbed from 164.03 million to 189.97 million, whereas legacy C2C forums dropped from 14.48 million to 10.36 million and P2P classified sites declined from 9.17 million to 7.14 million.
| E-Commerce Marketplace Model | Monthly Visits in April 2017 (Millions) | Monthly Visits in November 2017 (Millions) | Change (%) |
|---|---|---|---|
| B2C Platforms (Lazada, Tiki, Sendo, The Gioi Di Dong...) | 164.03 | 189.97 | +15.81% |
| C2C Forums (5giay, Muare, Enbac, EbayVN...) | 14.48 | 10.36 | -28.45% |
| P2P Classifieds (Nhattao, Rongbay...) | 9.17 | 7.14 | -22.14% |
The primary friction holding back digital checkout was limited banking access combined with fulfillment distrust. According to IDG Vietnam (2017) and Q&Me (2017), although 81% of banked citizens used e-banking services, only 42% of Vietnamese adults owned a bank account. Consequently, 88% of e-commerce transactions were paid via cash-on-delivery (COD) and only 12% used e-banking. Kantar TNS further reported that 44% of online shoppers complained about receiving products that did not match online quality claims.
"Online retailers need to focus more on building trust by ensuring the quality of delivered goods and offering cash payment options for first-time buyers." — Nitin Nishandar, Regional Managing Director, Brand & Shopper, Kantar TNS (cited on page 37 of the report).
Digital payments and the mobile fintech ecosystem in a cash-heavy economy
Vietnam remained a deeply cash-based economy in 2017–2018, yet low traditional banking penetration created substantial white space for mobile fintech providers. According to Statista (2017) and CK Finanzpro (2017), total e-payment transaction value in Vietnam reached USD 6.14 billion by the end of 2017 across 10 million e-wallet users. The market was projected to expand at a 22% compound annual growth rate (CAGR) to reach USD 12.33 billion by 2022, supported by the Government and State Bank of Vietnam roadmap to lower cash transactions to 20% and raise adult bank account ownership to 70% by 2020.
| Vietnam Fintech Segment | Share of Market Size in 2017 (%) | Projected Share in 2025F (%) | Projected CAGR 2017–2025F (%) |
|---|---|---|---|
| Consumer Digital Payments | >89% | ~85% | 12.8% |
| Personal Finance | ~9% | ~9% | 31.2% |
| Corporate Finance | ~2% | ~6% | 35.9% |
Market sizing by Solidiance (2018) cited on page 40 shows that Consumer Digital Payments accounted for over 89% of Vietnam's fintech revenue in 2017 and was forecast to grow at a 12.8% CAGR through 2025. Starting from smaller bases, Personal Finance (projected 31.2% CAGR) and Corporate Finance (projected 35.9% CAGR, tripling its market share from 2% in 2017 to 6% by 2025) represented the fastest-growing verticals.
Even so, consumer hesitation around mobile wallets remained high. Kantar TNS (2017) found that 46% of online consumers in Vietnam avoided mobile payments because they lacked a bank account or credit card and feared losing banking credentials. Product teams looking to reduce checkout friction can review our payment gateway integration checklist.
"The biggest challenge for mobile payment providers in Vietnam is convincing consumers who are comfortable with traditional payment methods to recognize the added value and security of switching to a new platform." — Michael Nicholas, Global Lead of Connected Solutions, Kantar TNS (cited on page 41 of the report).
Fintech ecosystem verticals and H1 2018 QR payment milestones
Across the H1 2018 competitive landscape, Appota highlighted five prominent mobile finance and wallet apps: MoMo (M_Service), BankPlus (Viettel), MISA Money Keeper, Appota Wallet, and Money Lover (Zoo Studio). The report's Vietnam Fintech Ecosystem map (page 43) spans nine verticals: Payments (AppotaPay, VNPAY, MoMo, ZaloPay, NAPAS, 123Pay, Moca, BaoKim, AirPay, NganLuong.vn, Payoo, VTC Pay, WePay...), Peer-to-Peer Lending & Credit Scoring (Tima, Mofin, Trusting Social, Lendmo...), Personal Finance, Crypto/Blockchain, Money Transfer, InsurTech, Digital Banking (Timo), and Data Hosting (KDATA).
Notable H1 2018 events included the Fintech Challenge Vietnam (launched in November 2017 by the State Bank of Vietnam and Mekong Business Initiative, won by Weezi Digital with Kiu and Wecash as runners-up) and Blockchain Festival Vietnam (May 24–25, 2018). The period also saw GrabPay's rollout alongside GrabFood and rapid QR code payment adoption across major banks (TPBank, Maritime Bank, Sacombank, LienVietPostBank) and PVOIL gas stations.
Mobile gaming consolidation, eSports prize pools, and low-CPI advertising
Within the mobile app market in Vietnam, mobile games generated the lion's share of store revenue but entered an intense consolidation phase during the first half of 2018. Monthly tracking from May 2017 to May 2018 by Statista (2017) and Adsota (2018) shows combined iOS and Android game downloads fluctuating between 88 million (January 2018) and 143 million (July 2017), standing at 124 million downloads in May 2018 (compared with 119 million in May 2017).
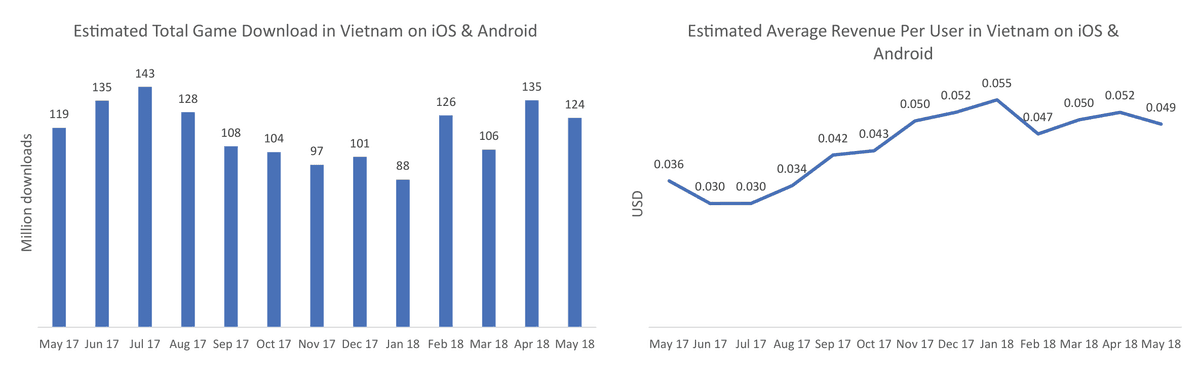
While download volume plateaued, monthly Average Revenue Per User (ARPU) climbed steadily. ARPU rose from USD 0.036 in May 2017 (and a June–July 2017 trough of USD 0.030) to a peak of USD 0.055 in January 2018, before settling at USD 0.049 in May 2018 (+36.1% year-over-year). This upward trajectory confirms that Vietnamese players were increasingly willing to spend on in-app purchases and premium game content.
Market shakeout was unmistakable in H1 2018 (Q1 + Q2 2018): only 21 new mobile games were released in Vietnam, whereas 47 mobile games shut down (more than 2.2 closures for every new launch). Rising licensing and live-ops costs squeezed out smaller studios, concentrating players into flagship titles backed by structured local operations — a process examined in our mobile game publishing guide in Vietnam.
Among the Top 100 most downloaded games in H1 2018 tracked by Adsota (2018), Action accounted for 22 titles, Casual for 16, Arcade for 14, and Puzzle for 11. Top download ranks were led by MOBA (Honour of Kings / Arena of Valor published by Garena) and surging Battle Royale titles (Garena Free Fire, NetEase's Rules of Survival, and Tencent Games' PUBG Mobile), alongside casual hits Helix Jump (VOODOO) and My Talking Tom (Outfit7).
| Year | Mobile eSports Prize Pool (Million VND) | PC + Console eSports Prize Pool (Million VND) | Combined eSports Prize Pool (Million VND) | Mobile Share of Total Prize Pool (%) |
|---|---|---|---|---|
| 2013 | 0 | 778 | 778 | 0.0% |
| 2014 | 0 | 1,559 | 1,559 | 0.0% |
| 2015 | 17 | 4,735 | 4,752 | 0.36% |
| 2016 | 2,071 | 6,508 | 8,579 | 24.14% |
| 2017 | 6,981 | 8,060 | 15,041 | 46.41% |
Community retention and brand sponsorship were propelled by the rapid rise of mobile eSports. According to Appota (2018), total prize pools across semi-pro and professional mobile eSports tournaments in Vietnam jumped from VND 17 million in 2015 to VND 2,071 million in 2016 and VND 6,981 million (nearly VND 7 billion) in 2017, nearly matching the VND 8,060 million prize pool of PC and Console competitions. Notably, Vietnam's national Arena of Valor team (anchored by Team Flash players) secured qualification for the 2018 Asian Games in Indonesia, marking the first time a Vietnamese mobile eSports squad competed in a continental multi-sport event.
Mobile advertising spend and Southeast Asia CPI benchmarks
On the monetization side, figures from eMarketer and IAB Singapore (2017) show that Vietnam's mobile advertising spend reached USD 78 million in 2017, representing 36.6% of total digital ad spending in the country (up from 13.1% in 2015 and 22.5% in 2016). Mobile's share of digital ad budgets in Vietnam was forecast to climb to 55.3% in 2018, 67.4% in 2019, and 68% (USD 200–220 million) by 2020.
For user acquisition teams evaluating the mobile app market in Vietnam, the country's standout advantage within Southeast Asia was its low Cost Per Install (CPI). According to 2018 benchmarks from Adsota and Chartboost, average CPI in Vietnam stood at USD 0.38 on Apple iOS and USD 0.15 on Android. That cost was four to nine times lower than regional leader Singapore (USD 1.67 on App Store and USD 1.37 on Google Play), positioning Vietnam alongside Indonesia and the Philippines as Southeast Asia's three fastest-growing mobile markets with the most cost-efficient user acquisition rates.
Across 2018, Adsota and Chartboost identified four primary trends shaping in-app advertising monetization:
- Mobile Video Ads: high in-app request volumes and strong engagement made video the top-performing ad format for both advertisers and publishers in 2017–2018.
- ePrivacy Directive and Ad Blocking (ITP): Intelligent Tracking Prevention (ITP), ad blockers, and stricter data protection rules required programmatic media buyers to adapt targeting workflows.
- Rising eCPMs: driven by growing smartphone penetration and in-app session times, global in-app eCPMs were projected to increase by roughly 4% month-over-month throughout 2018.
- Rewarded Ads: value-exchange video ads (granting in-app currency or items upon completion) delivered frictionless user experience, high completion rates for brands, and strong yield for publishers.
To explore all 60 pages of original charts, Android screen resolution breakdowns, the full Vietnam Fintech ecosystem map, and underlying dataset tables, complete the form on this page to download the full PDF report from Appota.
Sources
- Vietnam Mobile App Market Report — First Half of 2018 (Báo cáo thị trường ứng dụng di động Việt Nam nửa đầu năm 2018), Công ty Cổ phần Appota (Appota Group), 2018-07-11, accessed 2026-10-31
- Global Consumer Confidence Survey Q1 2018, The Conference Board, 2018-05-01, accessed 2026-10-31
- Vietnam Internet & Mobile Internet User Forecast 2016–2022, Euromonitor International & Statista (cùng Appota), 2018-03-01, accessed 2026-10-31
- Asia-Pacific Mobile User Segmentation & App Retention Benchmarks 2017, GSMA Intelligence & AppsFlyer, 2017-11-01, accessed 2026-10-31
- The Connected Consumer Study / Consumer Barometer 2017: Vietnam, Google Consumer Barometer & DI-Marketing (cùng Adsota), 2017-12-01, accessed 2026-10-31
- Vietnam Mobile OS, Screen Resolution & Q1 2018 Smartphone Market Share, StatCounter GlobalStats, Counterpoint Technology Market Research, IDC Indochina & BrandsVietnam, 2018-05-01, accessed 2026-10-31
- Vietnam App Store & Google Play Publisher and Category Rankings 2017, Applyzer, 2017-12-15, accessed 2026-10-31
- Connected Life 2017: Digital Attitude, E-Commerce Trust & Mobile Payment Barriers in Vietnam, Kantar TNS, 2017-11-15, accessed 2026-10-31
- Vietnam E-Commerce Market Survey, Map of E-Commerce & Web Traffic Analytics 2017, Q&Me, iPrice Group, ecommerceIQ, SimilarWeb & IDG Vietnam, 2017-12-20, accessed 2026-10-31
- Turning Cash into Cashless: Vietnam's Fintech Opportunity & Ecosystem Landscape 2018, Solidiance, CK Finanzpro, Mekong Business Initiative (MBI) & Fintechnews Singapore, 2018-06-01, accessed 2026-10-31
- Vietnam Mobile Game Downloads, ARPU, Title Closures & eSports Prize Pool 2013–H1 2018, Appota & Adsota (cùng Statista, VnExpress), 2018-07-01, accessed 2026-10-31
- Southeast Asia Mobile Advertising Spending & Cost Per Install (CPI) Benchmarks 2017–2020, eMarketer, IAB Singapore, Chartboost & Adsota, 2018-04-01, accessed 2026-10-31