
Vietnam Mobile Market Report Q3 2016
Appota's Q3 2016 report on the Vietnam mobile market analyzes mobile devices, social messaging, live-streaming, advertising, and payments across 48.5 million internet users. Vietnam recorded 25 million mobile devices (52% Android, 20% iOS), 80% Zalo penetration, a 57.4% mobile share of digital ad spend ($0.3–$0.8 CPI), and a 38% mobile e-commerce order share.
Analysis of the Vietnam mobile market in Q3 2016: 48.5M internet users, 25M mobile devices (52% Android, 20% iOS), 80% Zalo reach, live-streaming, Facebook Ads ($0.3–$0.8 CPI), and mobile payment conversion.
Key findings
- 48.5M Internet & 6% GDPBy Q3 2016, Vietnam recorded a population of more than 92 million, a 6% GDP growth rate, and 48.5 million internet users split across 52% male and 48% female users, led by the 15–40 age group (Appota).
- 25M devices: 52% Android, 20% iOSVietnam's active mobile base reached 25 million devices in Q3 2016, comprising 52% Android, 20% iOS, and 28% other devices; WVGA 480x800 (28.71%) and HD 720x1280 (26.12%) led Android screen resolutions across top brands Samsung, Sony, Asus, and Oppo (Appota).
- 80% iPhone 7 Plus & 70% 128GBDuring the first week of iPhone 7 and iPhone 7 Plus orders in Vietnam, 80% of buyers chose the iPhone 7 Plus (20% iPhone 7), 70% ordered 128GB storage (15% each for 32GB and 256GB), and 45% picked Jet Black (30% Black), at 32GB launch prices of $1,200 and $1,300 (CellphoneS).
- 80% Zalo & 73% MessengerAcross a survey of 1,200 smartphone users, Zalo led messaging apps in Vietnam at 80% (claiming 60 million worldwide users in September 2016), ahead of Facebook Messenger (73%), Viber (40%), and Skype (37%); top activities were text messaging (80%), sending photos (58%), phone calls (56%), video calls (40%), and voice messaging (23%) (DI Marketing).
- 53% funny videos & Top 3 LiveMobile video live-streaming grew rapidly across leading platforms YouTube, Facebook, and Bigo Live; top streaming genres in Vietnam were funny/entertaining videos (53%), breaking news (41%), music concerts/events (38%), broadcasts by friends/family (30%), and sports events (29%) (Appota).
- ~40% Game ads & 18:00–21:00 peakGames led mobile ad impressions served on Opera's platform in Vietnam in March 2016 (~40%), followed by Technology & Computing (~32%) and Arts & Entertainment (~17%); user logins and app downloads peaked between 18:00 and 21:00, with 20:00–23:00 identified as the ideal window to reach users (eMarketer, Appota).
- 57.4% digital ad share & $0.3–$0.8 CPIMobile ad spending captured 57.4% of total digital ad spend and 22.2% of total media ad spend in 2016 (projected to reach 68.2% and 32.1% by 2018); for mobile game Facebook Ads campaigns, Vietnamese publishers allocated 51% to Mobile App Installs and 24% to Post Engagement at $0.30–$0.80 CPI, $0.03–$0.10 CPC, and $1–$2 CPM (Facebook).
- 38% mobile orders & 77% CODIn Vietnamese e-commerce, mobile phones generated 38% of orders and 29% of revenue (tablets 7% of orders and 3% of revenue; PCs 55% of orders and 68% of revenue), while Cash on Delivery (COD) accounted for 77% of successful transactions versus 23% for Internet Banking (Dealtoday).
What Does the Q3 2016 Report Reveal About the Vietnam Mobile Market and Device Scale?
Published quarterly by Appota Joint Stock Company, the Q3 2016 Vietnam mobile market report (2016 Vietnam Mobile Report Q3 — An Overview of Trends & Insights) provides operational benchmarks across mobile devices, social applications, advertising, and payments. Spanning 19 slides, the publication combines primary telemetry from Appota with market datasets from CellphoneS, DI Marketing, eMarketer, Opera, Facebook, and Dealtoday.
Readers following our Gaming coverage can compare this edition with the Vietnam Mobile Apps Report Q3 2015 to track year-over-year shifts in device penetration and user acquisition costs. Part 1 of the study (slides 3–7) examines Vietnam's macroeconomic indicators, operating system share across 25 million mobile devices, Android screen resolutions, and first-week ordering patterns for the iPhone 7 and iPhone 7 Plus.
48.5 Million Internet Users Across a 92+ Million Population and 6% GDP Growth
According to Appota figures on slide 4 (Vietnam - A Rapidly Growing Tech Sector), Vietnam had become one of Southeast Asia's fastest-expanding technology markets by Q3 2016. Four foundational indicators frame the domestic digital economy:
- Total population (Population): Surpassed 92 million (
92+ million). - Economic expansion (GDP growth rate): Reached 6%.
- Connected population (Internet users): Reached 48.5 million (
48,5 M), representing more than half of the national population. - Demographic profile (M/F users): Male users accounted for 52% and female users accounted for 48%. Mobile internet access reshaped daily online habits, particularly within the core 15–40 age group.
25 Million Mobile Devices: 52% Android, 20% iOS, and Multi-Generation OS Fragmentation
On slide 5 (Vietnam Mobile Device Overview), Appota's central donut chart tracks 25 million active mobile devices (25M) in Vietnam during Q3 2016:
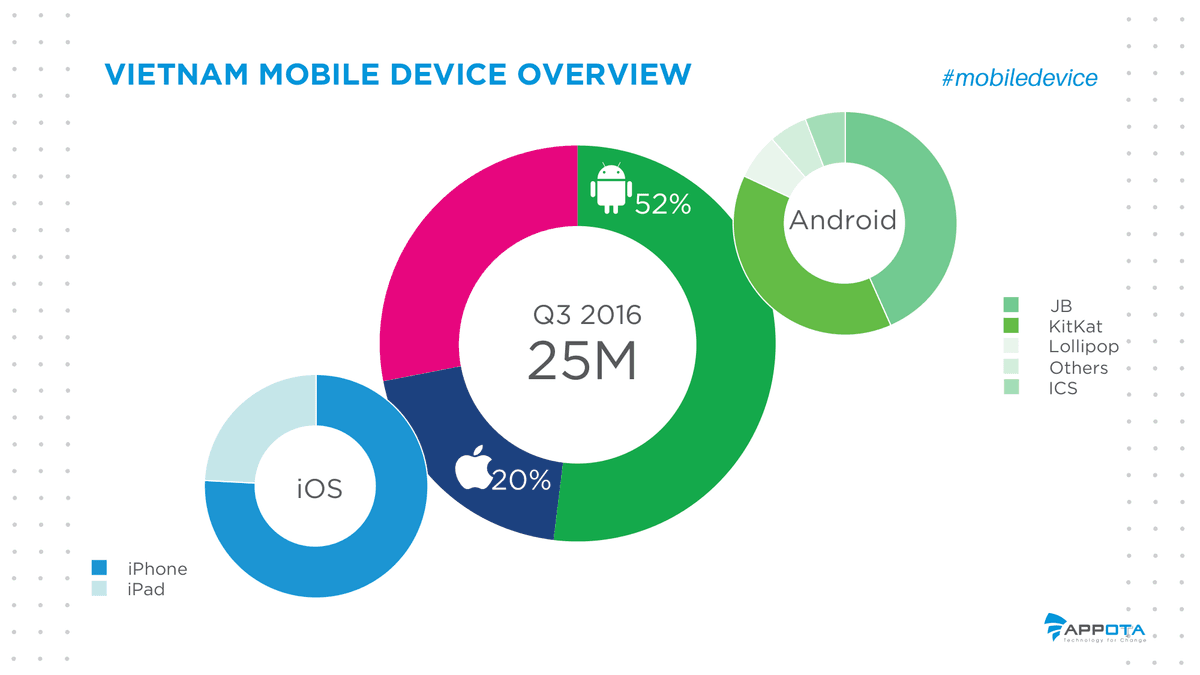
The slide 5 telemetry highlights Android's lead in total handsets alongside distinct hardware and firmware distributions within each platform:
- Operating system split across 25 million devices: Android captured 52% of the installed base (approximately 13 million devices), iOS held 20% (approximately 5 million devices), and the remaining 28% (plotted as an unlabeled pink arc of 100.6°/360°, or roughly 7 million devices) belonged to other mobile platforms.
- iOS form-factor distribution (iPhone vs. iPad): The bottom-left satellite donut segments Apple's installed base between iPhone (dark blue, representing ~75.8% of the plotted arc) and iPad (light teal, representing ~24.2% of the plotted arc).
- Android OS version breakdown: The top-right satellite donut lists five Android firmware tiers from top to bottom: Jelly Bean (
JB), KitKat, Lollipop, Others, and Ice Cream Sandwich (ICS). Measured by plotted slice angles, legacy JB (~43.3%) and KitKat (~38.6%) still powered more than 80% of active Android devices in Vietnam, ahead of Lollipop (~6.7%), ICS (~5.8%), and Others (~5.6%).
WVGA and HD Screens Power Over 70% of Android Phones Across Four Top Brands
On slide 6 (Android Screen Break Down), Appota details smartphone screen resolutions across Vietnam's Android base alongside the country's four most popular Android hardware brands.
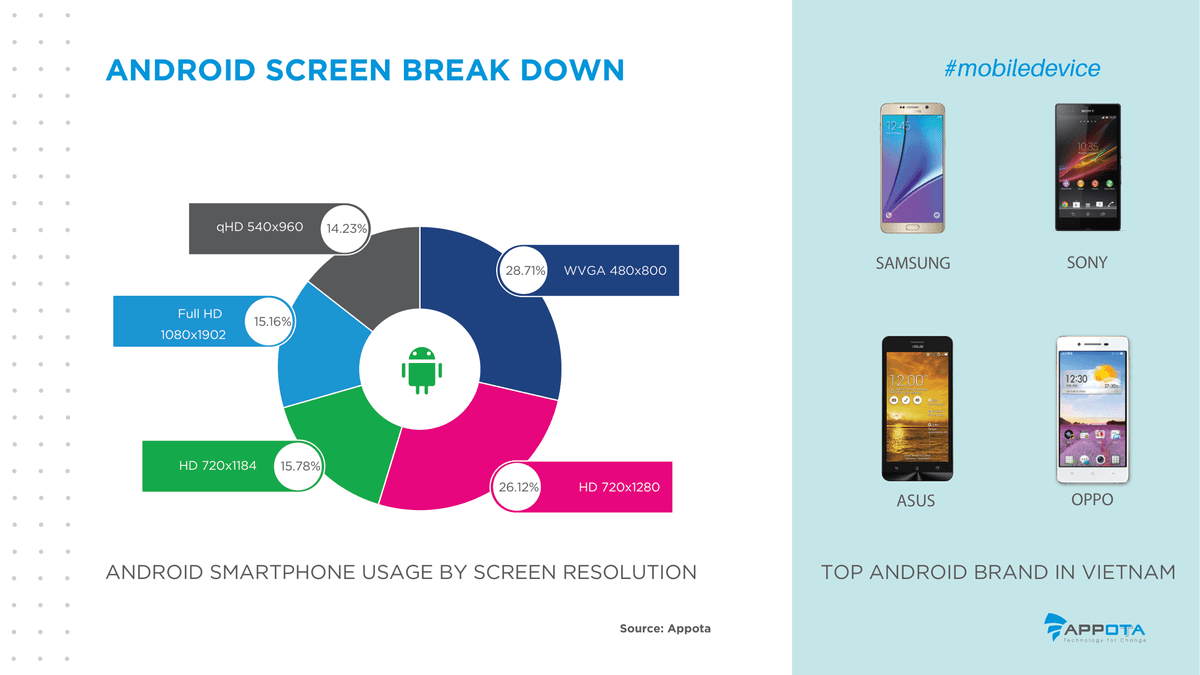
The slide 6 breakdown confirms that entry-level WVGA and mid-range 720p HD displays accounted for more than seven out of ten Android smartphones in Q3 2016:
- WVGA (480x800): Ranked first as a standalone resolution at 28.71% of Android smartphones.
- Combined HD 720p tier (720x1280 and 720x1184): Together accounted for 41.90% of all Android handsets, split between standard HD 720x1280 in second place at 26.12% and HD 720x1184 (accounting for on-screen navigation bars) in third place at 15.78%.
- Full HD (printed as 1080x1902 on the slide, standard 1080x1920): Captured 15.16% in fourth place, surpassing qHD.
- qHD (540x960): Accounted for the remaining 14.23% of active Android smartphones.
- Top Android brands in Vietnam (Top Android Brand in Vietnam): Led by Samsung, Sony, Asus, and Oppo. Product teams executing a mobile game soft launch checklist should test UI scaling across both compact WVGA (480x800) screens and 720p HD panels on devices from these four manufacturers.
| Device Benchmark Category (Slides 4–6) | Segment / Technical Specification | Share / Reported Value | Data Source |
|---|---|---|---|
| Macro & Internet Reach | Population / GDP Growth Rate / Internet Users | 92+ million / 6% / 48.5 million | Appota (slide 4) |
| Internet Demographics | Male / Female split & Core age bracket | 52% Male / 48% Female (15–40 years old) | Appota (slide 4) |
| Mobile Device Base (25M) | Android / iOS / Other (pink arc) | 52% / 20% / 28% | Appota (slide 5) |
| Android Resolutions (Top 3) | WVGA 480x800 / HD 720x1280 / HD 720x1184 | 28.71% / 26.12% / 15.78% | Appota (slide 6) |
| Android Resolutions (Other 2) | Full HD 1080x1902 / qHD 540x960 | 15.16% / 14.23% | Appota (slide 6) |
| Leading Android OEMs | Top 4 smartphone brands in Vietnam | Samsung, Sony, Asus, Oppo | Appota (slide 6) |
80% of First-Week Buyers Ordered iPhone 7 Plus and 70% Selected 128GB Storage
On slide 7 (How Vietnamese Order iPhone 7/7 Plus in the First Week), retail telemetry from CellphoneS captures early-adopter purchasing behavior during the launch week of Apple's flagship handsets in Vietnam:
| Ordering Dimension (Slide 7) | Primary Preference | Secondary Preference | Third Preference | Source |
|---|---|---|---|---|
| Handset Model (Model) | iPhone 7 Plus: 80% | iPhone 7: 20% | — | CellphoneS |
| Storage Capacity (Storage) | 128GB: 70% | 32GB: 15% | 256GB: 15% | CellphoneS |
| Color Finish (Favorite color) | Jet Black: 45% | Black: 30% | Other: 25% | CellphoneS |
| First-Week Price (32GB Tier) | iPhone 7: $1,200 | iPhone 7 Plus: $1,300 | Price spread: $100 | CellphoneS |
Even with first-week retail prices reaching $1,200 for the 32GB iPhone 7 and $1,300 for the 32GB iPhone 7 Plus, Vietnamese buyers overwhelmingly favored the larger dual-camera phablet (80% ordered iPhone 7 Plus), mid-high storage capacity (70% chose 128GB), and the two new black finishes (75% combined for Jet Black and Black).
How Did Vietnamese Users Engage With Messaging Apps, Live-Streaming, and Daily Downloads in Q3 2016?
Part 2 of the report (Vietnam Mobile Users' Behavior, slides 8–18) examines competition among Over-The-Top (OTT) messaging apps, the surge in mobile video live-streaming, app category ad impressions, and hourly download curves.
Zalo Leads With 80% Usage and 60 Million Users, Closely Followed by Facebook Messenger at 73%
On slide 9 (Vietnam's Messaging App Battle), a survey by DI Marketing across n = 1,200 smartphone users (where respondents selected up to their top 3 messaging apps) ranks the 10 most popular OTT messaging platforms in Vietnam:
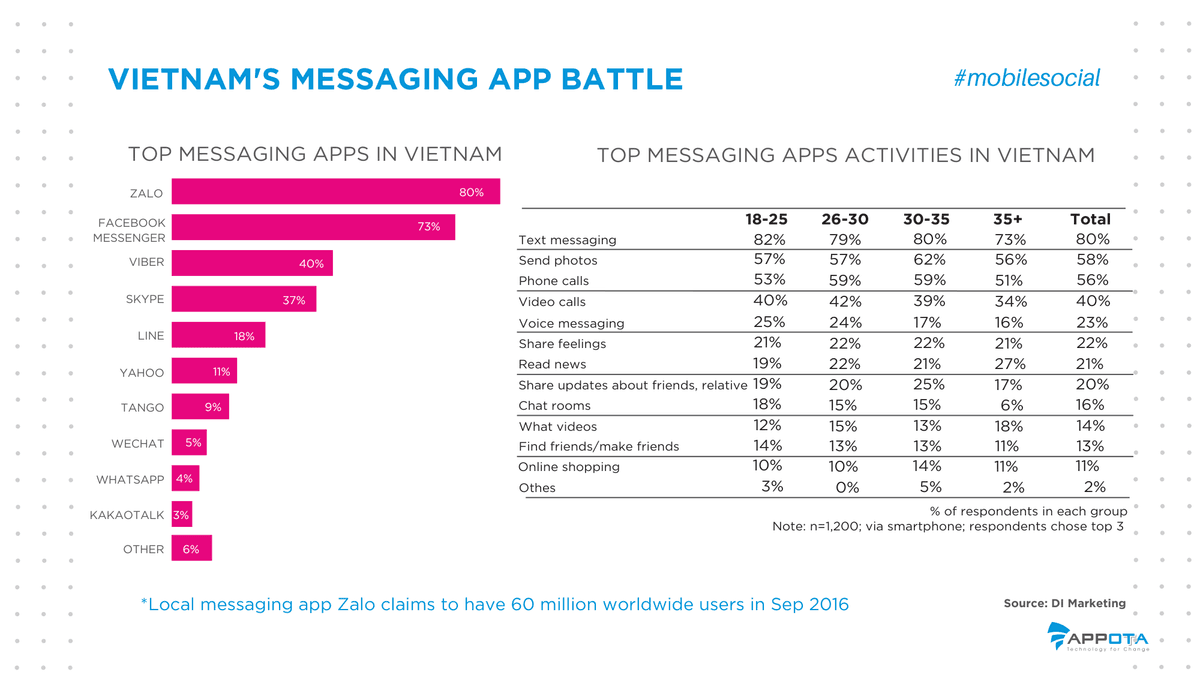
The slide 9 survey demonstrates a clear two-horse race at the top of Vietnam's social messaging market:
- Zalo and Facebook Messenger dominate daily reach (80% and 73%): Domestic platform Zalo ranked first at 80% penetration (with a slide footnote noting that Zalo claimed 60 million worldwide users in September 2016). Facebook Messenger followed closely in second place at 73%.
- Viber and Skype hold the secondary tier (40% and 37%): Viber ranked third at 40%, while Skype captured 37% on the strength of workplace communication.
- Remaining regional and global apps trail below 20%: Led by LINE (18%), Yahoo (11%), Tango (9%), WeChat (5%), WhatsApp (4%), KakaoTalk (3%), and Other (6%).
The accompanying table on slide 9 breaks down 13 messaging app activities across four demographic cohorts (18–25, 26–30, 30–35, and 35+):
| Messaging App Activity (Slide 9) | Ages 18–25 | Ages 26–30 | Ages 30–35 | Ages 35+ | Total Sample |
|---|---|---|---|---|---|
| Text messaging | 82% | 79% | 80% | 73% | 80% |
| Send photos | 57% | 57% | 62% | 56% | 58% |
| Phone calls | 53% | 59% | 59% | 51% | 56% |
| Video calls | 40% | 42% | 39% | 34% | 40% |
| Voice messaging | 25% | 24% | 17% | 16% | 23% |
| Share feelings | 21% | 22% | 22% | 21% | 22% |
| Read news | 19% | 22% | 21% | 27% | 21% |
| Share updates about friends, relatives | 19% | 20% | 25% | 17% | 20% |
| Chat rooms | 18% | 15% | 15% | 6% | 16% |
| Watch videos (What videos) | 12% | 15% | 13% | 18% | 14% |
| Find friends / make friends | 14% | 13% | 13% | 11% | 13% |
| Online shopping | 10% | 10% | 14% | 11% | 11% |
| Others (Othes) | 3% | 0% | 5% | 2% | 2% |
Age-cohort patterns reveal distinct habits: the 18–25 cohort led in text messaging (82%), voice messaging (25%), and chat rooms (18%); the 30–35 group led in sending photos (62%), sharing updates about friends and relatives (25%), and online shopping via messaging apps (14%); meanwhile, users aged 35+ over-indexed in reading news (27%) and watching videos (18%).
The Rise of Video Live-Streaming Across YouTube, Facebook, and Bigo Live
On slide 10 (The Rise of Video Live-Streaming), Appota notes that the convergence of mobile smartphones, localized media content, and efficient video delivery made live-streaming the next major technology race for active users in Vietnam. The three leading live-streaming platforms (Top live-stream apps) in Q3 2016 were YouTube, Facebook, and Bigo Live.
Slide 10 ranks the 10 most popular streaming content categories among Vietnamese mobile viewers:
- Funny / entertaining videos: Led all genres at 53%.
- Breaking news stories: Reached 41%.
- Music concerts / events: Reached 38%.
- Video broadcast by friends / family: Reached 30%.
- Sports events: Reached 29%.
- Educational talks / lectures (Educationals talks/lectures): Reached 27%.
- Videos broadcast by brands / companies: Reached 26%.
- Videos broadcast by celebrities: Reached 22%.
- Videos broadcast by vloggers (viedeo bloggers): Reached 19%.
- Videos broadcast from nights out / parties: Reached 15%.
Games Lead Ad Impressions (~40%) and Evening Downloads Peak Between 20:00 and 23:00
Slides 11 and 12 examine app category traffic by ad impressions alongside time-of-day usage curves:
- Games dominate mobile ad impressions on Opera's platform (slide 11): Citing eMarketer data from Opera's mobile advertising platform in Vietnam (March 2016), Games was the number-one category by impressions served (with its bar plotted at the full 40% mark on the 0–40% axis). Technology & Computing ranked second (~32%), Arts & Entertainment placed third (~17%), followed by Music, Video & Media (~7%), Sports (~4%), and News & Information (~2%).
- Logins and downloads spike during the 18:00–21:00 evening window (slide 12): Appota's dual-line chart tracks Login Time (pink curve) and Download volume (dark blue curve) across six daily intervals (
1–6,6–12,12–15,15–18,18–21, and21–24). Both metrics reach a secondary morning peak during 06:00–12:00 (~26%), drop to their afternoon trough during 15:00–18:00 (~5% for downloads, ~10% for logins), and surge to their daily zenith during 18:00–21:00 (~36%–37% for downloads and ~32%–33% for logins). Appota notes that users habitually download games and apps in the evening, making 20:00–23:00 (8:00 – 11:00 PM) the ideal window to reach users.
| Time Window (Slide 12) | Plotted Download Share (Blue Line) | Plotted Login Time Share (Pink Line) | Behavioral Pattern (Source: Appota) |
|---|---|---|---|
01:00 – 06:00 (1-6) |
~11% | ~8% | Overnight off-peak hours |
06:00 – 12:00 (6-12) |
~26% | ~26% | Secondary morning commute and work-start peak |
12:00 – 15:00 (12-15) |
~11% | ~15% | Midday lunch break; logins exceed new downloads |
15:00 – 18:00 (15-18) |
~5% | ~10% | Lowest daytime trough across both metrics |
18:00 – 21:00 (18-21) |
~36% – 37% | ~32% – 33% | Primary evening surge for app installs and sessions |
21:00 – 24:00 (21-24) |
~10% – 11% | ~12% – 13% | Late-night engagement; 20:00–23:00 is the ideal reach window |
How Did Mobile Ad Spend Grow and How Did Publishers Run Facebook Ads for Mobile Games?
On slides 13 and 14 (#mobileads), the report cites Facebook data to track multi-year mobile ad spend expansion (2014–2018) and break down how Vietnamese game publishers structured Facebook Ads campaigns in Q3 2016.
Mobile Ad Spend Captures 57.4% of Digital Budgets in 2016 and Heads Toward 68.2% by 2018
According to Facebook figures on slide 13 (Mobile Ad Spend Will Continue to Gain Share), mobile advertising steadily expanded its share of both digital and total media budgets over the five-year window:
| Year | Mobile Share of Total Digital Ad Spending | Mobile Share of Total Media Ad Spending | YoY Gain (Digital Share / Total Media Share) |
|---|---|---|---|
| 2014 | 29.9% | 8.7% | Baseline year (Source: Facebook, slide 13) |
| 2015 | 46.2% | 15.6% | +16.3 pp / +6.9 pp |
| 2016 | 57.4% | 22.2% | +11.2 pp / +6.6 pp |
| 2017 (Projected) | 64.4% | 27.8% | +7.0 pp / +5.6 pp |
| 2018 (Projected) | 68.2% | 32.1% | +3.8 pp / +4.3 pp |
In 2016, mobile advertising crossed the majority threshold to capture 57.4% of all digital ad spending and more than one-fifth (22.2%) of total media ad spending. By 2018, mobile was projected to command more than two-thirds (68.2%) of digital budgets and nearly one-third (32.1%) of all media spend.
Vietnamese Game Publishers Allocate 51% of Facebook Ads to App Installs at $0.30–$0.80 CPI
On slide 14 (How Vietnamese Publishers Run FB Ads Campaigns for a Mobile Game), Facebook data illustrates the exact mix of nine campaign objectives deployed by Vietnamese publishers for a mobile game launch alongside average pricing benchmarks:
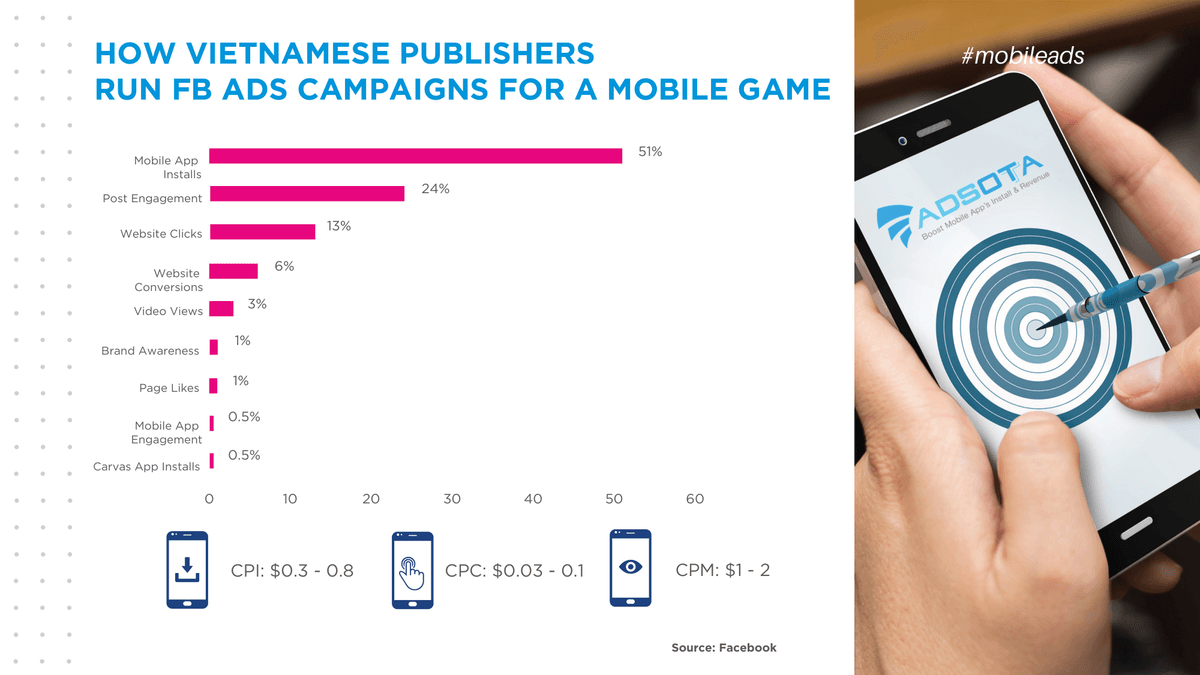
Teams managing mobile game publishing in Vietnam concentrated 88% of their Facebook campaigns across three primary acquisition and community objectives:
- Mobile App Installs: Accounted for 51% of campaigns—more than half of all ad activity focused directly on driving store installs.
- Post Engagement: Accounted for 24%, fueling fanpage discussions, social events, and gift-code distribution.
- Website Clicks: Accounted for 13%, routing traffic to game landing pages and direct APK download portals.
- Website Conversions: Captured 6% for pre-registration and web event funnels.
- Video Views: Captured 3% for gameplay trailers and promotional teasers.
- Four supplementary objectives (3% combined): Included Brand Awareness (1%), Page Likes (1%), Mobile App Engagement (0.5%), and Canvas App Installs (Carvas App Installs, 0.5%).
Slide 14 also reports three core media-buying cost benchmarks for mobile game campaigns in Vietnam during Q3 2016:
- CPI (Cost per install): $0.30 – $0.80.
- CPC (Cost per click): $0.03 – $0.10.
- CPM (Cost per mille / 1,000 impressions): $1.00 – $2.00.
How Did Mobile Payments, E-Commerce Conversion, and Vietnam's Mobile Game Landscape Evolve?
Slides 15 through 19 connect consumer payment touchpoints, nine mobile payment instruments, e-commerce conversion splits by device, and a 12-segment landscape map of Vietnam's mobile gaming industry.
A Connected Consumer's Daily Journey and Nine Forms of Mobile Payment in Vietnam
Slide 15 (A Day in the Life of a Connected Consumer) maps five daily mobile commerce and payment touchpoints for an urban Vietnamese smartphone user:
- 08:00 AM (
8AM #gotowork): Booking a morning commute ride via Uber or Grab. - 10:00 AM (
10AM #drinkcoffee): Paying for coffee via the Moca mobile wallet app. - 12:00 PM (
12AM #lunchon the slide): Settling lunch and utility bills through Payoo. - 04:00 PM (
4PM #purchaseontime): Shopping on the Lazada mobile commerce app. - 09:00 PM (
9PM #watchmovie): Booking movie tickets via the CGV Cinemas mobile app.
On slide 16 (What Are Forms of Mobile Payment in Vietnam?), Appota categorizes nine distinct mobile payment methods operating in the domestic market:
- SMS Payment: Billing digital content or top-ups via premium SMS shortcodes.
- Mobile commerce: In-app and mobile-web shopping cart checkouts.
- mPOS (Mobile Point of Sale): Card-reader dongles paired with smartphones for physical merchants.
- QR Payment: Quick-response code scanning at retail counters or on bills.
- Social mobile payment: Peer-to-peer transfers and social commerce payments inside messaging/social apps.
- USSD (Unstructured Supplementary Service Data): Carrier dial-code sessions (illustrated by
*102*809723971). - Direct Carrier Billing: Charging Google Play, Facebook, or game purchases directly to a 3G/4G mobile balance.
- Card-On-File Payments (Card-On-Fire Payments on slide): Stored credit or debit cards enabling one-tap in-app checkout.
- mBanking (Mobile Banking): Dedicated banking apps for transfers and bill settlement.
Appota emphasizes that not all mobile payment methods convert equally: application-based and mobile banking-based solutions hold clear usability and conversion advantages over legacy SMS or USSD flows.
Mobile Phones Generate 38% of Orders and 29% of Revenue While COD Accounts for 77% of Transactions
On slide 17 (Mobile Payment Behaviour by Conversion), transaction telemetry from Dealtoday compares order volume and revenue share across devices alongside payment method completion rates:
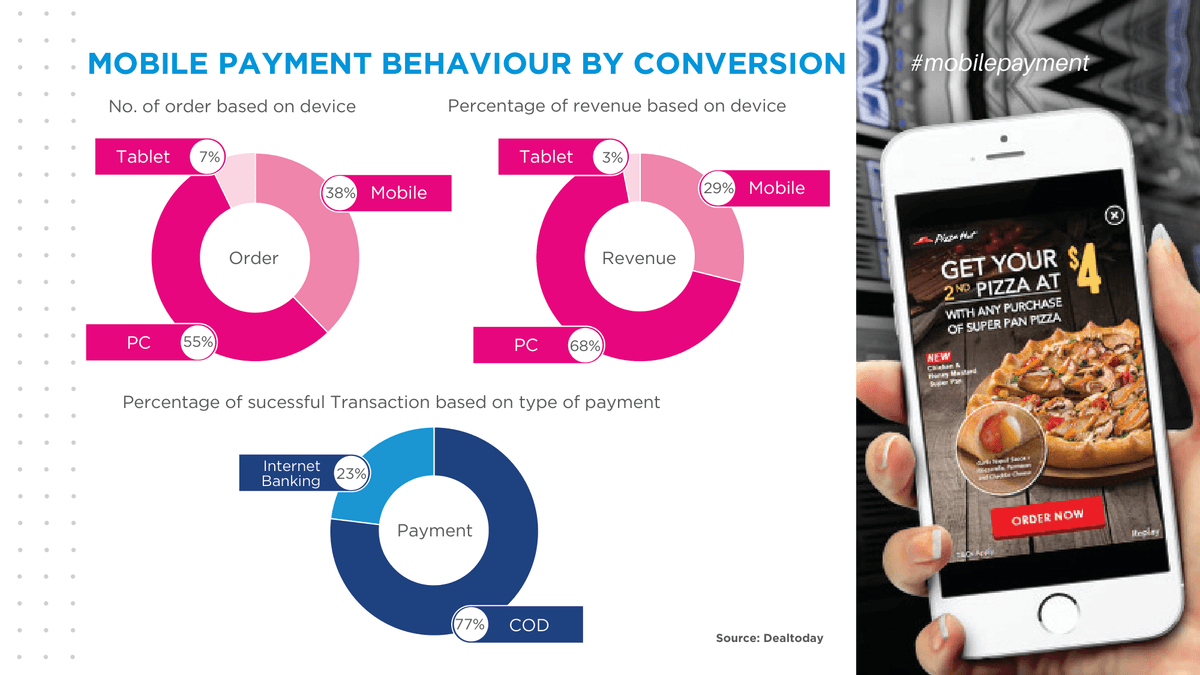
The three donut charts on slide 17 highlight both the rise of mobile ordering and the persistent gap in average order value and online payment completion:
| Conversion Metric (Slide 17) | Desktop (PC) | Smartphone (Mobile) | Tablet | Data Source |
|---|---|---|---|---|
| Share of Orders (No. of order based on device) | 55% | 38% | 7% | Dealtoday (slide 17) |
| Share of Revenue (Percentage of revenue based on device) | 68% | 29% | 3% | Dealtoday (slide 17) |
| Revenue-to-Order Spread | +13 pp | -9 pp | -4 pp | Higher basket size on PC |
Combined, smartphones (38%) and tablets (7%) generated 45% of all e-commerce orders and 32% of total revenue on Dealtoday. However, when measured by successful transactions by payment type (Percentage of successful transaction based on type of payment), Cash on Delivery (COD) still accounted for 77%, while Internet Banking captured 23%. Reducing checkout friction through a structured payment gateway integration checklist is essential for lifting online payment share on mobile devices.
The 12-Category Vietnam Mobile Game Landscape and Appota's Core Ecosystem
On slide 18 (Vietnam Mobile Game Landscape), Appota maps the key companies and platforms operating across 12 segments of Vietnam's mobile game ecosystem in Q3 2016:
| Ecosystem Segment (Slide 18) | Representative Companies and Platforms Mapped |
|---|---|
| 1. Publisher | Gamota, ME Corp, CMN Online, VNG, Asiasoft, VTC Game, VTC Mobile, SohaGame, mwork/.NET, SSGroup, Wasabi, Mobo Market, VIMarket |
| 2. Developer | Divmob, Joy Entertainment, .GEARS, Hiker Games, GlassEgg, Canvas, Colorbox, Fury, Guava7, Banana, Gameloft, Endios Interactive, Tofu Game Studio, Tinhvan Outsourcing, plus Bluebird Award studios (ABI, Senspark, Emobi Games, MD Studio, Funkoi, Hoppi, VMoga…) |
| 3. Mobile Advertising Agency | Adsota, CleverAds, Admicro, Adtima, Moore, Dentsu |
| 4. Advertising Network | Facebook, Adsota, AdMob, Cốc Cốc, Admatic, Admicro, ANTS Programmatic Ad, AdFlex, Adtima |
| 5. Mobile Affiliate Network | Adsota, AdFlex, Sàn Game, Gmob, MobiAdZone, Mwork |
| 6. Reward Based Platform | Appdaily, iCoin, MobiCoin, Tozaco, Săn Xu, iXu, Kiếm Tiền |
| 7. Payment Supplier | OnePAY, Payoo, Epay, iPay, VTC Pay, Mobivi, NganLuong.vn, Smartlink, SohaPay, VinaPay, 123Pay |
| 8. Tracking Service | Google Analytics, AppsFlyer, Adjust |
| 9. Media | GameHub.vn, Gamethu, GameK.vn, GameTV, GameVN, OGate, Omga, XemGame, Game4V, PlayPark, Infogame |
| 10. Live Streaming Platform | Twitch, YouTube, ccTalk |
| 11. Social Gaming Platform | onClan, Zalo, LINE, Viber, KakaoTalk |
| 12. Appstore & Server Hosting | Appstores: App Store, Google Play, Appvn, Mobo Market, HipStore, 365 App · Hosting: KDATA, Tenten.vn, VCCloud, NhanHoa.com, Mắt Bão, vHost |
Concluding on slide 19 (About Appota), Appota positions its mobile platform across three high-growth segments in Vietnam—Game Publishing, Advertisement, and Payment—powered by six core products: Adsota, Gamota, Appota Pay, GameHub.vn, onClan, and Appota Card.
Four Strategic Takeaways for Mobile Publishers and Digital Businesses
Grounded in Appota's Q3 2016 dataset, product executives, user acquisition teams, and digital merchants in Vietnam can act on four priorities:
- Optimize Android Builds for WVGA/HD Displays (70.61%) While Supporting High-Spec iPhone 7 Plus Assets: Because 28.71% of Android smartphones ran WVGA (480x800) and 41.90% ran 720p HD displays—while Jelly Bean and KitKat still accounted for over 80% of Android firmware—studios must keep base APK builds lightweight for Samsung, Sony, Asus, and Oppo devices while offering high-resolution asset packs for premium iOS users (80% of launch-week iPhone 7 orders selected iPhone 7 Plus and 70% chose 128GB).
- Schedule User Acquisition Bursts for 18:00–23:00 Using the 51% Install / 24% Engagement Split: With app downloads and logins peaking during 18:00–21:00 and the ideal reach window spanning 20:00–23:00, marketing teams running Facebook Ads should anchor roughly 51% of campaign activity in Mobile App Installs (targeting $0.30–$0.80 CPI), supported by 24% in Post Engagement and 13% in Website Clicks ($0.03–$0.10 CPC).
- Pair Zalo/Messenger Community Channels With Entertaining Live-Stream Video Content (53%): Given Zalo's 80% reach and Facebook Messenger's 73% penetration among smartphone users, publishers should integrate OTT customer retention with live-streaming broadcasts on YouTube, Facebook, and Bigo Live focused on entertaining segments (53%), music events (38%), and sports (29%).
- Streamline In-App and Mobile Banking Checkout to Close the 38% Order vs. 29% Revenue Gap: Because mobile phones generated 38% of e-commerce orders but only 29% of revenue—and COD still represented 77% of completed transactions versus 23% for Internet Banking—merchants and publishers should prioritize one-tap Card-on-File, mBanking, QR Payment, and Direct Carrier Billing integrations inside their mobile apps.
Sources
- Vietnam Mobile Report Q3 2016 — An Overview of Trends & Insights, Công ty Cổ phần Appota (Appota), 2016-11-16, accessed 2026-11-02
- Hệ thống dữ liệu thiết bị di động, video live-streaming, khung giờ tải ứng dụng và bản đồ hệ sinh thái game mobile Việt Nam (Quý 3/2016), Công ty Cổ phần Appota (Appota), 2016-11-16, accessed 2026-11-02
- How Vietnamese Order iPhone 7/7 Plus in the First Week (Vietnam Q3 2016), CellphoneS, 2016-09-25, accessed 2026-11-02
- Vietnam's Messaging App Battle: Top Messaging Apps & Activities by Age Group (Q3 2016, n=1,200), DI Marketing, 2016-09-15, accessed 2026-11-02
- Most Popular Types of Apps in Vietnam Based on Impressions (Opera Mobile Ad Platform, March 2016), eMarketer & Opera Mediaworks, 2016-05-01, accessed 2026-11-02
- Mobile Ad Spend Share (2014–2018) & Facebook Ads Campaigns for Mobile Games in Vietnam (Q3 2016), Facebook & Adsota, 2016-09-30, accessed 2026-11-02
- Mobile Payment Behaviour by Conversion in Vietnam: Device Order Share, Revenue Share & Payment Methods (Q3 2016), Dealtoday, 2016-09-30, accessed 2026-11-02