
Vietnam Mobile Apps Report Q3 2015
Appota's Q3 2015 report on mobile apps in Vietnam analyzes domestic telemetry across 18 million users alongside global market benchmarks. Vietnam recorded a 63% Android user share, 52% iOS 8 and 35% Android Lollipop adoption, 84% of mobile ad impressions inside apps at $0.3–$1 CPI, and a 90% cross-platform overlap among top titles.
Analysis of Appota's 18-million-user telemetry for Q3 2015: iOS 8 (52%), iOS 9 (13%), and Android Lollipop (35%) adoption, 84% in-app ad share, $0.3–$1 CPI benchmarks, Appdaily launch, and top Vietnamese apps.
Key findings
- 82.8% Android & 51% iOS 9In Q2 2015, Android led the global smartphone OS market with an 82.8% share as iOS declined 22.3% QoQ to 13.9% (47.5 million shipments) and Windows Phone fell 4.2% QoQ (8.8 million units); by September 19, 2015, iOS 9 achieved record 51% global adoption, while Android Lollipop reached 21% behind KitKat's 39.2% (IDC, Apple, Google Dev).
- 1.6M+ apps & $45.37B revenueGlobal Android developers outnumbered iOS developers roughly 4 to 3 (44.6% vs. 33.4%); Google Play surpassed 1.6 million available apps in 2015 compared with 1.5 million on the Apple App Store, while global app store revenues were projected to reach $45.37 billion alongside $300 billion in mobile e-commerce sales (Stack Overflow, Statista, AppFigures, VisionMobile).
- 63% Android & 31% iOS in VNVietnam's smartphone user base in Q3 2015 comprised 63% Android, 31% iOS, and 6% Windows Phone; meanwhile, Vietnam's plotted 3G connection speed stood at just 0.1 Mbps, trailing regional peers Thailand (2.3 Mbps) and the Philippines (1.6 Mbps) (Appota, Facebook, Ericsson Mobility Report).
- 52% iOS 8, 13% iOS 9 & 35% LollipopIn Vietnam, iOS 8 adoption surged from 29% to 52% and newly launched iOS 9 captured 13% within its release quarter (as iOS 6 dropped from 27% to 11%); on Android, Lollipop more than doubled from 16% to 35% while Jelly Bean fell from 50% to 33%, and Samsung led Android smartphone OEMs with a 36% share (Appota).
- 1.4 devices/person & 59% socialVietnamese consumers owned an average of 1.4 devices per person and 57% of people under age 44 used a smartphone; weekly smartphone activities were led by social networking (59%), search engines (56%), online video viewing (54%), music listening (43%), and gaming (28%), with daily app downloads peaking at 20:00 (Google Dev, Appota).
- 84% in-app & 86.2% smartphoneAcross Vietnam's mobile advertising market, smartphones generated 86.2% of ad impressions (tablets 13%, feature phones 0.9%) and mobile apps captured 84% of impressions versus 16% on mobile websites; Samsung devices accounted for 32% of total impressions, while OS impression share split across 54.9% Android, 30.7% iOS, and 13.2% Windows Phone (InMobi).
- $0.3–$1 CPI & 57% content adsVietnamese users favored mobile ads that helped them download mobile content (57%), find good deals (46%), learn about brands (44%), and locate nearby places (33%); average unit costs stood at $0.01–$0.03 CPC, $0.3–$0.4 incentive CPI, $0.5–$1 non-incentive CPI, and $1–$2 CPM, with each incentive reward network delivering 5,000–20,000 installs per day (Vserv, Adsota).
- 18M users & 100k+ AppdailyAppota's distribution platform reached 18 million users in Vietnam by Q3 2015 as 9 of the Top 10 Vietnamese apps overlapped across iOS and Android; Appota's new Appdaily incentive platform topped 100,000 installs in its first week, and the Android Store Việt Nam Facebook page reached 1,134,462 fans (Appota).
How Did Global OS and Store Economics Shape Mobile Apps in Vietnam in Q3 2015?
Published on October 9, 2015 by Appota Joint Stock Company (Appota Inc.), the Q3 2015 report on mobile apps in Vietnam (Vietnam Mobile Apps Report Q3 2015) provides quarterly operational benchmarks for app developers, digital marketers, and game publishers. Across 34 slides, the study combines primary Q3 2015 platform telemetry from Appota's distribution ecosystem—where Vietnam accounts for 18 million users (slides 2–3)—with datasets from IDC, Apple, Google Dev, Stack Overflow, Statista, AppFigures, VisionMobile, Ericsson, InMobi, Vserv, and Adsota.
Readers following our Gaming research can compare these figures against the State of Mobile Apps in Vietnam Q1 2015 Report to see how Appota's domestic user base expanded from 13 million to 18 million users within two quarters. Chapter 1 (slides 5–11) establishes the global baseline across smartphone operating systems, OS version adoption, developer mindshare, and app store revenues.
Android Holds 82.8% Global Smartphone Share While iOS 9 Reaches Record 51% Adoption
According to IDC figures on slide 6 (Global OS breakdown), Android dominated the global smartphone market in Q2 2015 (2015/Q2) with an 82.8% market share. The three-year trend chart spanning Q2 2012 through Q2 2015 shows Android consolidating above the 80% threshold after climbing steadily between 2012 and 2014.
In second place, Apple's iOS saw its Q2 2015 market share decline by 22.3% quarter-over-quarter (QoQ) to 13.9% on 47.5 million unit shipments, reflecting seasonal pre-launch cyclicality ahead of autumn iPhone releases. Over the same quarter, Windows Phone experienced a 4.2% QoQ decline with 8.8 million units shipped, while BlackBerry OS—despite minor gains in select regions—continued its global contraction.
| Platform / OS Version | Global Share | Shipments / Momentum | Measurement Period & Slide Source |
|---|---|---|---|
| Android (Total Smartphone OS) | 82.8% | Maintained global market lead | Q2 2015 — IDC (slide 6) |
| iOS (Total Smartphone OS) | 13.9% | 47.5M shipments (-22.3% QoQ) | Q2 2015 — IDC (slide 6) |
| Windows Phone (Total OS) | ~3.3% (residual) | 8.8M shipments (-4.2% QoQ) | Q2 2015 — IDC (slide 6) |
| iOS 9 / iOS 8 / Earlier | 51% / 41% / 8% | Fastest iOS adoption rate in Apple history | Sep 19, 2015 — Apple (slide 7) |
| Android KitKat / Lollipop | 39.2% / 21% | Lollipop combines Android 5.0 and 5.1 | Q3 2015 — Google Dev (slide 8) |
Measured by operating system version, slide 7 (Global iOS breakdown) cites official Apple App Store measurements taken on September 19, 2015. iOS 9 achieved the fastest adoption rate ever recorded for an Apple release, surpassing 50% of active devices within days of launch: iOS 9 accounted for 51%, iOS 8 held 41%, and Earlier versions represented just 8%.
By contrast, Google Dev figures on slide 8 (Global Android breakdown) illustrate multi-generation fragmentation across the global Android installed base. While Android Lollipop (inclusive of Android 5.0 and 5.1) gained momentum to reach 21%, the largest share of Android devices still ran KitKat at 39.2%, alongside four legacy tiers plotted on the donut chart (Jelly Bean, Ice Cream Sandwich, Gingerbread, and Froyo).
Android Developers Outnumber iOS 4 to 3 as Global App Store Revenue Reaches $45.37 Billion
On slide 9 (Global mobile developers mindshare), Stack Overflow survey data shows Android developers outnumbering iOS developers by roughly 4 to 3. Specifically, 44.6% of mobile developers identified with Android compared with 33.4% for iOS, while Windows Phone (WP) attracted just 2.3%. The accompanying commentary notes that 20% of mobile developers do not identify with a single mobile platform, corresponding to the third horizontal bar labeled Java (19.8%) on the chart.
On slide 10 (Global mobile apps by number), multi-year data from Statista and AppFigures tracks total available apps across the two leading storefronts from 2012 to 2015:
- Google Play Store exceeds 1.6 million apps: Following more than 50% catalog expansion over the prior year, Google Play reached 1.6 million available apps in 2015 (climbing from 0.35 million in 2012, 0.37 million printed on the 2013 bar, and 1.3 million in 2014).
- Apple App Store reaches 1.5 million apps: Apple's storefront catalog expanded from 0.5 million apps in 2012 to 0.8 million in 2013, 1.25 million in 2014, and 1.5 million in 2015.
| Year | Apple App Store Catalog (Millions) | Google Play Store Catalog (Millions) | Global App Store Revenue (USD Billions) | YoY Revenue Growth |
|---|---|---|---|---|
| 2011 | Not plotted on slide 10 | Not plotted on slide 10 | $8.32B | Baseline year (slide 11) |
| 2012 | 0.50M | 0.35M | $18.56B | +123.1% |
| 2013 | 0.80M | 0.37M (bar height plotted near ~0.75M) | $26.68B | +43.8% |
| 2014 | 1.25M | 1.30M | $34.99B | +31.1% |
| 2015 (Projected) | 1.50M | 1.60M | $45.37B | +29.7% |
Turning to monetization on slide 11 (Global mobile apps revenue growth), projections from Statista and VisionMobile show global app store sales expanding 5.45x over four years—rising from $8.32 billion in 2011 to $18.56 billion in 2012, $26.68 billion in 2013, $34.99 billion in 2014, and $45.37 billion in 2015. Alongside direct app store billings, mobile e-commerce was projected to generate $300 billion in global mobile sales during 2015.
How Did OS Adoption, Hardware Share, and User Behavior Shift in Vietnam in Q3 2015?
Chapter 2 (slides 12–20) examines internet usage patterns, mobile network constraints, operating system upgrades, and weekly smartphone habits across Vietnam.
On slide 13 (Vietnam mobile news), the report highlights three market catalysts in Q3 2015: Instagram opened self-serve advertising to all marketers in Vietnam; Vietnam Television (VTV) hosted the Bluebird Award (Giải thưởng Chim Xanh), a nationwide competition for indie mobile game developers; and Facebook Messenger introduced video calling alongside voice calls, intensifying competition for domestic and regional OTT messaging apps.
Android Captures 63% of Vietnamese Smartphone Users Against Constrained 3G Speeds
Slide 14 pairs domestic OS distribution from Appota and Facebook with regional network speed benchmarks from the Ericsson Mobility Report.
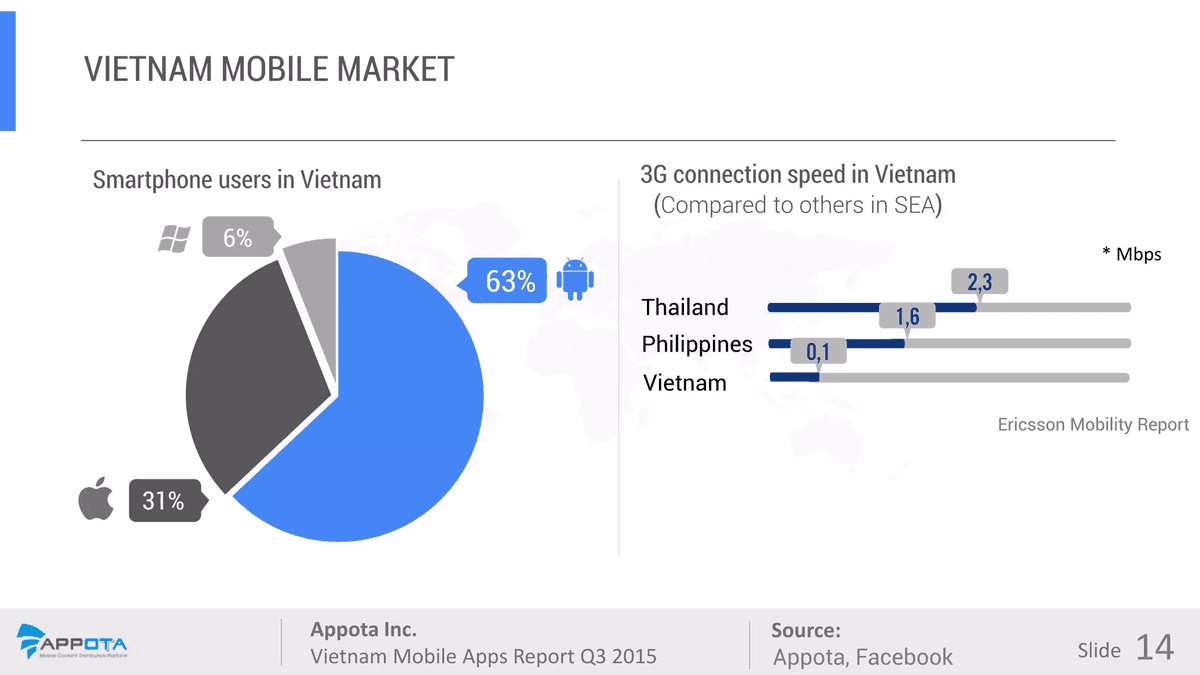
On the left pie chart (Smartphone users in Vietnam), Android accounted for 63% of Vietnamese smartphone users, iOS held 31%, and Windows Phone represented 6%. Notably, iOS penetration among Vietnamese smartphone users (31%) was more than double Apple's global shipment share (13.9% on slide 6), underscoring strong iPhone adoption in Vietnam's urban centers.
On the right bar chart (3G connection speed in Vietnam), data from the Ericsson Mobility Report plots Vietnam's average 3G connection speed at 0.1 Mbps, well behind Southeast Asian peers Thailand (2.3 Mbps) and the Philippines (1.6 Mbps). That mobile bandwidth bottleneck explains why Vietnamese users favored compact APK/IPA installer sizes and concentrated heavy game downloads during evening Wi-Fi hours.
iOS 8 Jumps to 52%, iOS 9 Reaches 13%, and Android Lollipop More Than Doubles to 35%
Slides 15 and 16 track quarter-over-quarter operating system upgrades across Appota's domestic device network (where the visual chart legends print Q1/2015 and Q2/2015, while the underlying slide text layer and iOS 9 release commentary confirm the comparison spans Q2 2015 to Q3 2015):
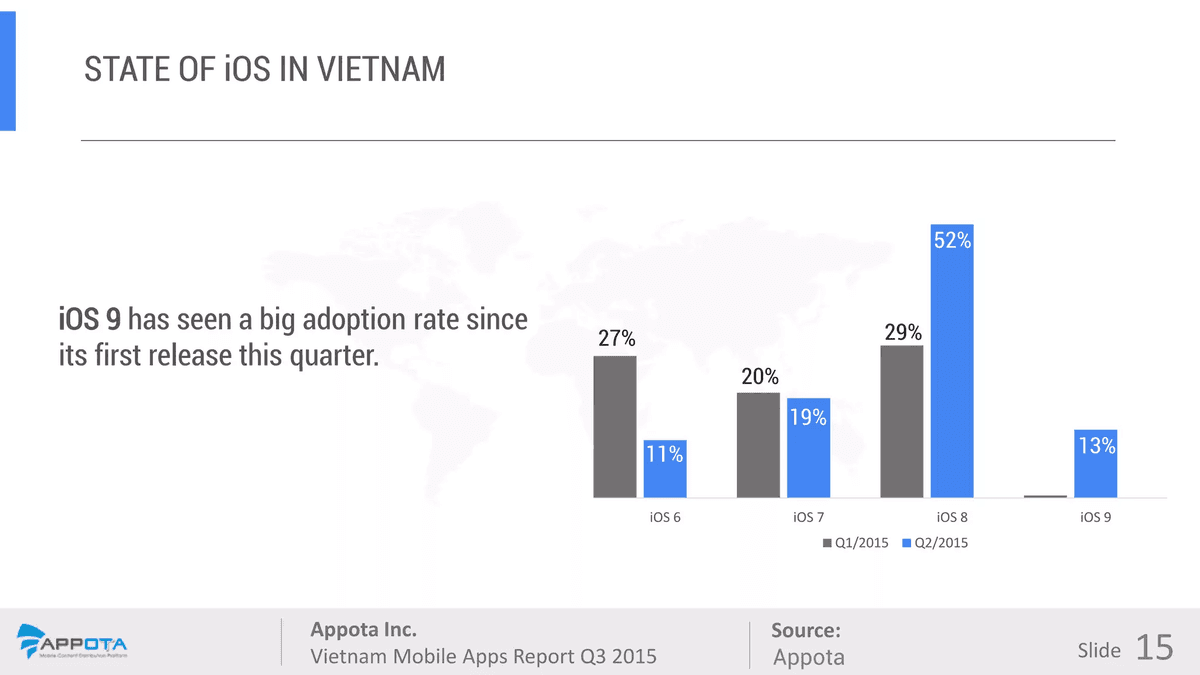
- Rapid migration to iOS 8 and iOS 9 (slide 15): iOS 8 surged by 23 percentage points from 29% to 52%, becoming the majority operating system across Vietnamese iDevices. Meanwhile, newly released iOS 9 captured 13% within its launch quarter. Legacy versions contracted sharply as iOS 6 dropped from 27% to 11% (-16 percentage points) and iOS 7 edged down from 20% to 19%.
- Android Lollipop surges to 35% (slide 16): Google's newest release, Android Lollipop, more than doubled its domestic share from 16% to 35% (+19 percentage points), overtaking both KitKat and Jelly Bean.
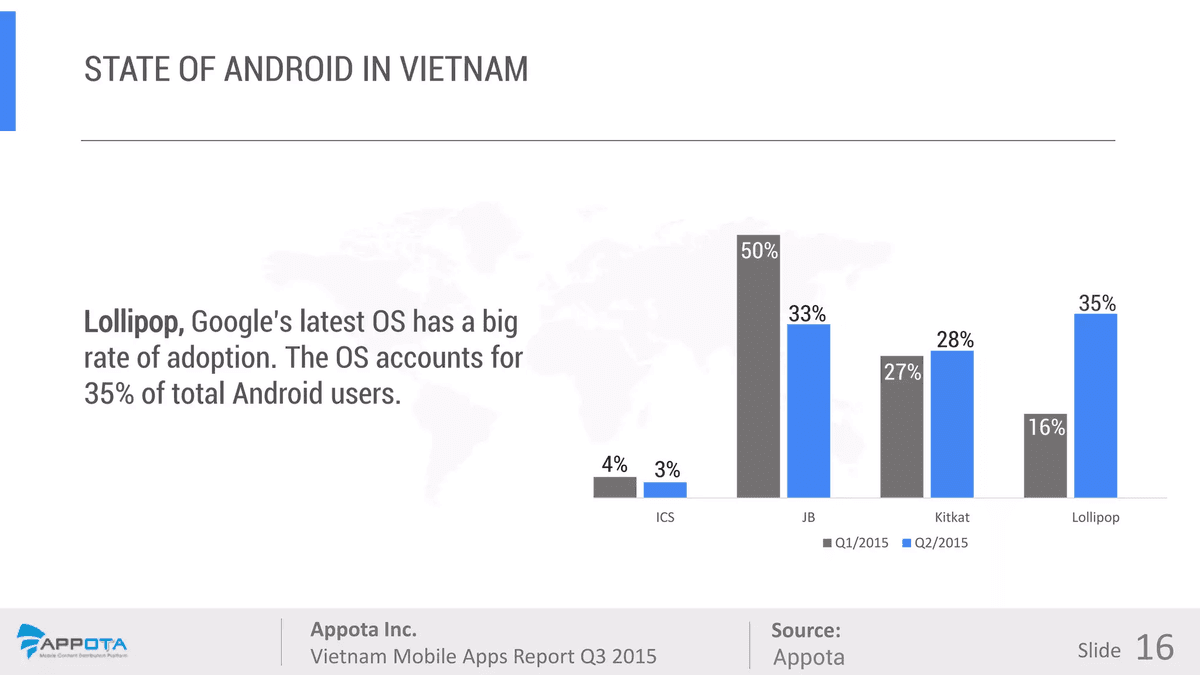
- Jelly Bean contracts as Samsung widens its OEM lead (slides 16–17): Jelly Bean (JB) fell 17 percentage points from 50% to 33%, KitKat ticked up from 27% to 28%, and Ice Cream Sandwich (ICS) dipped from 4% to 3%. On the hardware manufacturer breakdown (
Android vendor breakdown, slide 17), Samsung expanded its leadership to 36% of Android smartphones in Vietnam (up from 27% in Q1 2015), attracting more users than the next five brands combined. Asus and LG followed at 7% each, eight mid-tier vendors (Sony, Sky, HTC, Lenovo, Google, OPPO, Nokia, and Huawei) accounted for a combined 24%, and Other brands held 26%. Engineering teams running a mobile game soft launch checklist should prioritize QA testing on Android Lollipop (35%) and iOS 8–9 (65% combined).
1.4 Devices per Person, 54% Weekly Video Viewing, and a 20:00 Download Peak
Slides 18 through 20 combine consumer behavior surveys from Google Dev with 24-hour download telemetry from Appota:
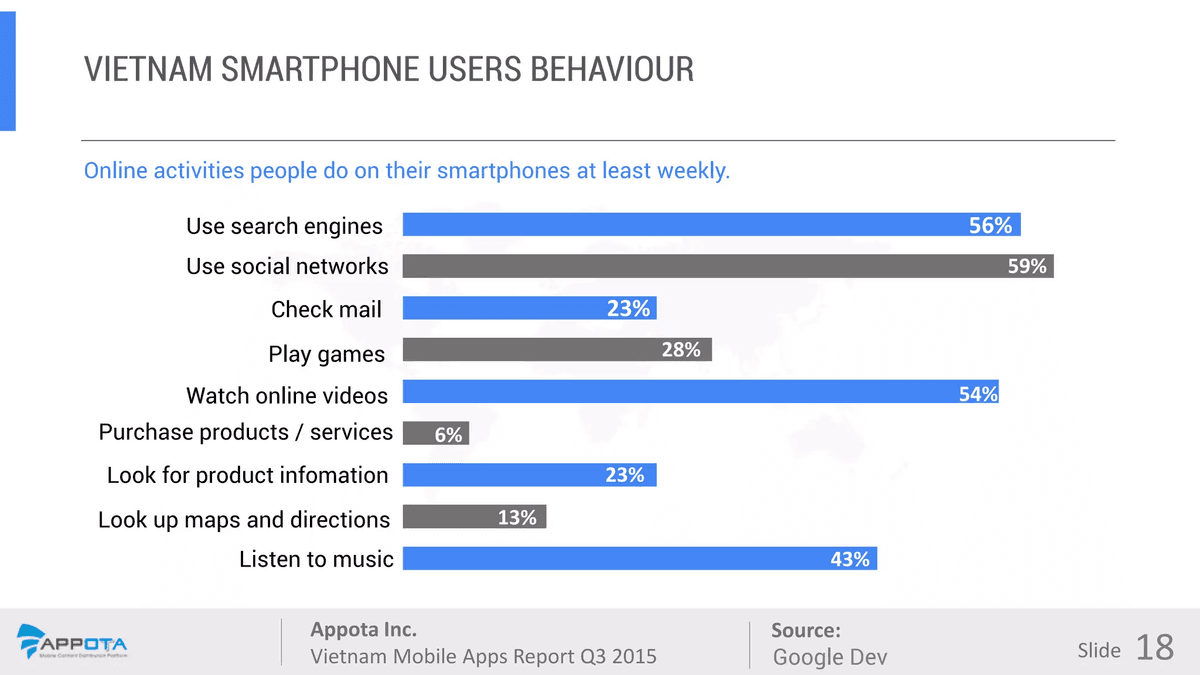
Slide 18 (Online activities people do on their smartphones at least weekly) ranks nine core weekly mobile activities among Vietnamese smartphone users:
- Mass-reach weekly habits (above 50%): Using social networks led all activities at 59%, followed closely by Using search engines at 56% and Watching online videos at 54%.
- Mid-tier entertainment and research (23%–43%): Listening to music reached 43%, Playing games stood at 28%, while Checking mail and Looking for product information tied at 23% each.
- Navigation and direct mobile commerce (6%–13%): Looking up maps and directions accounted for 13%, whereas Purchasing products / services directly on a smartphone stood at 6%.
| Vietnam User Behavior Metric (Slides 18–20) | Specific Indicator | Reported Value | Source |
|---|---|---|---|
| Multi-screen ownership | Average connected devices per person | 1.4 devices per person | Google Dev (slide 19) |
| Demographic penetration | Share of people under age 44 using a smartphone | 57% (Under-25 cohort highest) | Google Dev (slide 19) |
| Weekly activities (Top 3) | Social networks / Search engines / Online videos | 59% / 56% / 54% | Google Dev (slide 18) |
| Weekly activities (Media & Info) | Music / Games / Email / Product information | 43% / 28% / 23% / 23% | Google Dev (slide 18) |
| Weekly activities (Maps & Commerce) | Maps & directions / Purchasing products or services | 13% / 6% | Google Dev (slide 18) |
| Daily download curve | Trough / Midday bump / Evening peak (Crest) | 04:00 / 12:00–14:00 / 18:00–22:00 (20:00) | Appota (slide 20) |
On slide 19, Google Dev reports that Vietnamese consumers owned an average of 1.4 devices per person (Vietnam has more screens than ever) and that 57% of people under age 44 used a smartphone. Usage rates were highest across the three youngest brackets highlighted in the dashed box (Under 25 years, 25–34 years, and 35–44 years), trailing off among the 45–54 years and 55 and over cohorts.
On slide 20 (Popular time for downloads), Appota's 24-hour download curve drops to its daily trough around 04:00, crosses above the horizontal daily average line around 07:00, forms a secondary midday bump between 12:00 and 14:00, dips around 16:00, and surges into the red evening peak window between 18:00 and 22:00, cresting at 20:00 (highest).
How Did Mobile Advertising Networks, CTR Formats, and CPI Costs Operate in Vietnam in Q3 2015?
Chapter 3 (slides 21–30) introduces a dedicated deep dive into Vietnam's mobile advertising ecosystem, covering ad network models, impression distribution, CTR performance, user acquisition pricing, and top apps on Appota's platform.
Non-Incentive vs. Incentive Ad Networks and an 84% In-App Impression Share
On slide 21 (Mobile ad network models), Adsota classifies Vietnam's mobile advertising landscape into two distinct models:
- Non-incentive ads: Encompassing Mobile Web ads, In-app ads, Search ads, Video ads, and SMS/MMS ads. The eight most popular non-incentive ad networks in Vietnam were AdMob by Google, Facebook, Mobvista, Adsota, AdFlex, Admicro, Adtima, and InMobi.
- Incentive ads: Operating as Incentive reward platforms where users receive rewards for installing and opening apps, led by Appdaily, Tozaco, and iCoin (alongside Kiemxu in the slide's underlying text layer).
On slides 22 and 23, InMobi telemetry breaks down Vietnam's mobile ad impressions across four dimensions:
- By device form factor (slide 22): Smartphones generated 86.2% of mobile ad impressions, Tablets accounted for 13%, and Feature phones represented 0.9%.
- By environment (slide 22): Fully 84% of mobile ad impressions were served inside mobile apps, more than five times the 16% served on mobile websites.
- By hardware manufacturer (slide 23): Samsung maintained its lead as the top manufacturer, generating 32% of total mobile ad impressions nationwide.
- By operating system (slide 23): Android accounted for 54.9% of ad impressions, iOS captured 30.7%, and Windows Phone generated 13.2%. Notably, Windows Phone's 13.2% impression share was more than double its 6% smartphone user share (slide 14), reflecting heavy ad-supported usage on Windows handsets.
Ad Format CTR Rankings, User Ad Preferences, and Average CPC, CPI, and CPM Benchmarks
On slide 24 (Top performing mobile apps ad-types by Click-through-rate), Adsota ranks five mobile ad formats from highest to lowest Click-Through Rate (CTR): Search ads ranked first, followed by Social ads in second place, Banner ads in apps in third, Banner ads in websites in fourth, and Rich media - video ads in fifth.
On slide 25 (Users love mobile ads that help them), research from Vserv identifies the value propositions that drive Vietnamese users to engage with mobile ads: 57% favored ads that helped them download mobile content, 46% responded to ads helping them find a good deal on something, 44% used ads to learn about a brand, and 33% valued ads that helped them locate something nearby.
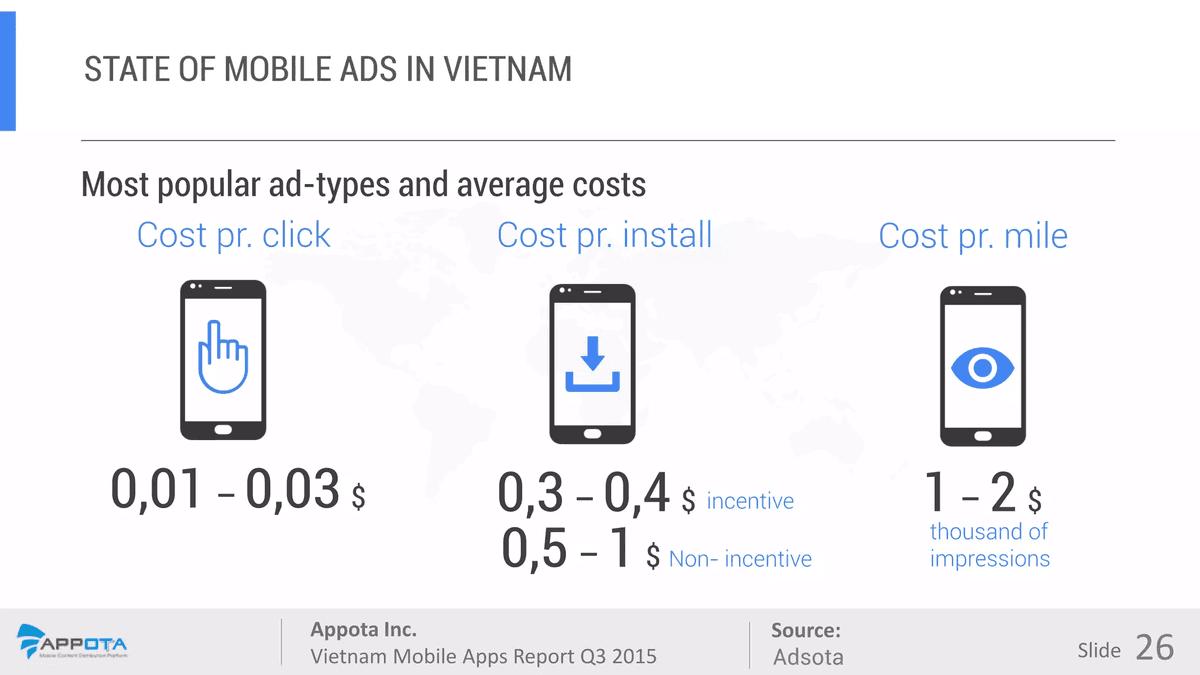
On slide 26 (Most popular ad-types and average costs), Adsota published average media buying benchmarks for Vietnam in Q3 2015:
| Pricing Model | Segment / Billing Unit | Average Cost Range (USD) | Operational Role in Vietnam Campaigns (Slides 26–28) |
|---|---|---|---|
| CPC (Cost per click) | Per ad click | $0.01 – $0.03 | Cost-effective traffic generation for mobile web and landing pages |
| CPI (Cost per install) | Incentive installs | $0.30 – $0.40 | Rapid store chart bursts; each platform delivers 5,000–20,000 installs/day |
| CPI (Cost per install) | Non-incentive installs | $0.50 – $1.00 | High-retention organic user acquisition via AdMob, Facebook, and Adsota |
| CPM (Cost per mille) | Per 1,000 impressions | $1.00 – $2.00 | Brand awareness across in-app banners and mobile video inventory |
Slides 27 and 28 highlight three fast-growing mobile advertising trends in Vietnam during Q3 2015:
- Boom in incentive reward platforms: Numerous domestic players entered the rewarded-install space, with each platform delivering approximately 5,000 to 20,000 installs per day (
5 - 20k installs a day). - Rapid adoption of mobile video ads: Millions of daily smartphone video views (backed by 54% weekly video reach on slide 18) drove strong advertiser demand for mobile video ad units.
- Instagram advertising rollout: With roughly 1.5 million active users in Vietnam displayed on the slide 28 visual callout (and 700,000 in the underlying text layer), Instagram delivered higher engagement than competing channels at a premium cost, illustrated by live sponsored posts from
appdaily.vn,thienlongbatbo3d, andgratis_apps.
Nine of the Top 10 Vietnamese Apps Overlap Across iOS and Android
Slides 29 and 30 present the 10 top-performing Vietnamese apps and games on Appota's platform across iOS and Android in Q3 2015. Teams planning mobile game publishing in Vietnam can review the cross-platform alignment in the table below.
| Grid Position (Row & Column) | Top 10 Vietnamese iOS Apps (Slide 29) | Top 10 Vietnamese Android Apps (Slide 30) | Genre & Cross-Platform Status |
|---|---|---|---|
| Row 1 — Col 1 | Zing mp3 | Tiếu Ngạo Giang Hồ | Music streaming / 3D martial-arts MMORPG (Both on iOS & Android) |
| Row 1 — Col 2 | Tiếu Ngạo Giang Hồ | Zing Mp3 | 3D martial-arts MMORPG / Music streaming (Both on iOS & Android) |
| Row 1 — Col 3 | NCT (NhacCuaTui) | Đồ sát mobile | Music streaming / Action PK MMORPG (Both on iOS & Android) |
| Row 1 — Col 4 | I am Naruto | Chinh Đồ Mobile | Manga card RPG / Nation-warfare RPG (Both on iOS & Android) |
| Row 1 — Col 5 | Đồ sát mobile | NCT (NhacCuaTui) | Action PK MMORPG / Music streaming (Both on iOS & Android) |
| Row 2 — Col 1 | Chinh Đồ Mobile | I am Naruto | Nation-warfare RPG / Manga card RPG (Both on iOS & Android) |
| Row 2 — Col 2 | Liên minh huyền thoại (LMHT Mobile) | Hiệp Khách | MOBA strategy game / Martial-arts RPG (Both on iOS & Android) |
| Row 2 — Col 3 | Hiệp Khách | Liên minh huyền thoại (LMHT Mobile) | Martial-arts RPG / MOBA strategy game (Both on iOS & Android) |
| Row 2 — Col 4 | Vua bóng đá | MobiTivi | Football management (iOS only) / TV streaming (Both OS) |
| Row 2 — Col 5 | MobiTivi | UC Browser Tiếng Việt | TV streaming (Both OS) / Data-saving browser (Android only) |
Compared with Q1 2015 (when 6 of 10 titles overlapped), Q3 2015 showed 9 out of 10 titles appearing simultaneously on both iOS and Android: six mobile games (Tiếu Ngạo Giang Hồ, Đồ Sát Mobile, Chinh Đồ Mobile, I am Naruto, Liên Minh Huyền Thoại, and Hiệp Khách) and three entertainment apps (Zing MP3, NCT, and MobiTivi). The sole divergence was Vua bóng đá on iOS versus UC Browser Tiếng Việt on Android.
How Did Appota's 18-Million-User Ecosystem, Appdaily, and Android Store Vietnam Drive Growth?
Chapter 4 (slides 31–33) summarizes four ecosystem milestones executed by Appota in Q3 2015 across its 18-million-user domestic network (supported by core products onClan, Appota Distribution Platform, GameHub.vn, and Adsota on slide 2):
- Launch of the Boost Top service for mobile apps (slide 31): A specialized ranking acceleration service helping publishers propel their apps and games to the top of store charts within a short window. Slide 31 screenshots showcase Tiếu Ngạo Giang Hồ 3D (#1) and Zing MP3 (#2) topping the Apple App Store Free chart alongside Đồ Sát Mobile (GAMOTA) (#1) on Google Play's Top Free Games chart.
- Official partner of the Bluebird Award (Giải thưởng Chim Xanh, slide 31): Partnering with Vietnam Television on the country's largest indie mobile game development competition.
- Launch of Appdaily hitting 100,000+ installs in week one (slide 32): Appota's incentive reward platform surpassed 100,000 installs in its first launch week. Its Top 3 Campaigns delivered 100,000+ installs/week for Ải Mỹ Nhân, 90,000+ installs/week for Lịch Như Ý, and 40,000+ installs/week for Quỷ Kiếm 3D.
- Android Store Việt Nam fanpage exceeds 1.13 million fans (slide 33): Appota's Android Store Việt Nam community became the largest Vietnamese tech page on Facebook with 1,134,462 total fans, generating 15,681 new page likes/week, 2,164,246 user engagements/week, and 125,000 average reach per post.
Four Strategic Priorities for Mobile App and Game Publishers in Vietnam
Drawing on Appota's Q3 2015 findings, product leaders, user acquisition managers, and game studios operating in Vietnam can execute four high-impact decisions:
- Optimize Installer Sizes for 3G Networks and Upgrade QA Matrices to iOS 8–9 and Android Lollipop: Because Vietnam's plotted 3G speed stood at 0.1 Mbps while iOS 8 + iOS 9 reached 65% of iOS devices (52% and 13%) and Android Lollipop climbed to 35% (with Samsung holding 36% of Android phones), studios should keep initial binary packages lightweight, stream asset bundles over Wi-Fi, and prioritize Lollipop and iOS 8/9 compatibility testing.
- Blend Incentive CPI ($0.30–$0.40) and Non-Incentive CPI ($0.50–$1.00) Around the 18:00–22:00 Peak: Publishers should combine burst campaigns on incentive reward platforms like Appdaily (delivering 5,000–20,000 installs/day at $0.30–$0.40 CPI) to capture Top Free chart visibility during launch week with non-incentive campaigns ($0.50–$1.00 CPI across AdMob, Facebook, and Adsota) timed to the 20:00 download crest.
- Focus Media Spend on In-App Inventory (84%), High-CTR Search/Social Formats, and Video Units: With 84% of ad impressions occurring inside mobile apps and 57% of users favoring ads that help them download mobile content, marketers should anchor budgets in in-app placements, deploy mobile video ads to reach the 54% weekly video audience, and test Instagram campaigns targeting the under-44 demographic (57% smartphone adoption).
- Synchronize Cross-Platform Releases With Frictionless Local Payment Flows: The 90% overlap between the Top 10 iOS and Android charts confirms that major RPG, MOBA, and media releases should launch simultaneously across both operating systems; however, because only 6% of smartphone users purchased products or services weekly via mobile browser flows, publishers should streamline in-app billing using a comprehensive payment gateway integration checklist.
Sources
- Vietnam Mobile Apps Report Q3 2015 (SlideShare ID 53730499), Công ty Cổ phần Appota (Appota Inc.), 2015-10-09, accessed 2026-11-02
- Worldwide Smartphone OS Market Share Trend (Q2 2012 – Q2 2015), International Data Corporation (IDC), 2015-08-20, accessed 2026-11-02
- Global iOS 9 Adoption & Global Android OS Version Distribution (Q3 2015), Apple App Store & Google Developers (Google Dev), 2015-09-19, accessed 2026-11-02
- Global Mobile Developers Mindshare (Stack Overflow Developer Survey 2015), Stack Overflow, 2015-04-08, accessed 2026-11-02
- Global Mobile Apps by Number (2012–2015) & Global Mobile Apps Revenue Growth (2011–2015), Statista, AppFigures & VisionMobile, 2015-09-01, accessed 2026-11-02
- 3G Connection Speed in Southeast Asia — Ericsson Mobility Report (2015), Ericsson (Ericsson Mobility Report), 2015-06-01, accessed 2026-11-02
- State of Mobile Ads in Vietnam: Device, App/Web, Manufacturer & OS Impression Share (Q3 2015), InMobi, 2015-09-15, accessed 2026-11-02
- Users Love Mobile Ads That Help Them — Vserv Mobile Audience Insights (2015), Vserv, 2015-08-01, accessed 2026-11-02
- Hệ thống phân phối nội dung di động Appota, mạng quảng cáo Adsota, nền tảng Appdaily và cộng đồng Android Store Việt Nam (Quý 3/2015), Công ty Cổ phần Appota (Appota Inc. & Adsota), 2015-10-09, accessed 2026-11-02