State of Mobile Apps in Vietnam Q1 2015 Report
Appota's Q1 2015 report on mobile apps in Vietnam examines global operating system trends, developer language preferences, and domestic download behavior. Globally, Google Play surpassed 1.43 million apps as 71% of developers prioritized Android, while Vietnam recorded over 120 million downloads (+32% YoY) across 9,000 local titles.
Analysis of 120M+ downloads across mobile apps in Vietnam during Q1 2015 (+32% YoY), iOS 8 (31%) and Android KitKat (54%) adoption, Swift usage (20%), and top local games from Appota.
Key findings
- 81.5% & 1.1B unitsAndroid captured 81.5% of the global smartphone OS market in 2014 with roughly 1.1 billion units shipped (+32.0% from 802.2 million in 2013), while Apple's iOS held 14.8% share on 192.7 million units (+25.6% from 153.4 million in 2013) and Windows Phone grew 4.2% YoY (IDC).
- 71% Android & 20% SwiftIn Q1 2015, 71% of full-time professional mobile developers prioritized Android (ahead of iOS at 54%, Windows Phone at 30%, and Web Apps at 25%); by programming language, Java led at 57% (ahead of HTML5 at 55%, Objective-C at 39%, C# at 38%, and C/C++ at 37%) while Apple's new Swift language reached 20% (Developer Economics).
- 1.43M apps & +70% revAvailable apps on Google Play grew by more than 50% in 2014 to exceed 1.43 million, overtaking the Apple App Store (1.21 million apps, a gap of about 17%) for the first time, though iOS App Store apps still generated 70% more full-year revenue than Google Play (AppFigures, App Annie).
- 23% and 8% on iOS 8By the end of Q1 2015 in Vietnam, iOS 8 accounted for 23% of iPhone users and 8% of iPad users (31% of total active iOS devices) driven by upgrades from iOS 7, while iPhone 5 expanded to roughly 30% of all iDevices to overtake iPad (Appota).
- 54% KitKat & 43%–27% SamsungAcross Android devices in Vietnam, KitKat led with a 54% OS market share as Jelly Bean dropped 10 percentage points QoQ to 25% and Lollipop reached 18%; Samsung led hardware vendors with 43% of Android tablets and 27% of Android smartphones (Appota).
- 120M+ downloads (+32%)Vietnam's mobile ecosystem in Q1 2015 recorded 9,000 Vietnamese apps and games and over 120 million downloads, growing 15% from Q1 to Q4 2014 (index 100% to 115%) and 32% YoY in Q1 2015 (index 132%), with Games gaining 16 percentage points of total download share (Appota).
- >60% in Hanoi & HCMCHanoi and Ho Chi Minh City generated more than 60% of nationwide app downloads; daily download curves in Vietnam mirrored Indonesia and China by peaking in the evening window from 18:00 to roughly 22:30 (InMobi, Appota).
How Did Global OS and Store Trends Shape Mobile Apps in Vietnam in Q1 2015?
Released on April 10, 2015 by Appota Joint Stock Company, the Q1 2015 report on mobile apps in Vietnam (State of mobile apps in Vietnam Q1/2015) provides quarterly operational benchmarks for mobile developers and game publishers. The 21-slide study combines primary telemetry from Appota's distribution platform (reaching 13 million users in Vietnam) with international datasets from IDC, Developer Economics, AppFigures, App Annie, and InMobi. Readers following our Gaming coverage can compare these figures directly against the Vietnam Mobile Market and Mobile Game Report Q1 2014 to track a full year of structural shifts.
The opening three sections of the deck (slides 3–7) establish the global context. They cover 2014 smartphone operating system shipments, developer platform and language priorities, and the catalog-versus-revenue split between Google Play and the Apple App Store.
Android Crosses One Billion Annual Shipments to Capture 81.5% Global OS Share
According to IDC figures cited on slides 3 and 4, Android crossed the one-billion-unit annual shipment milestone in 2014. Global manufacturers shipped approximately 1.1 billion Android smartphones during 2014, representing a 32.0% increase over the 802.2 million units shipped in 2013 (exact arithmetic yields 1,058.9 million units, rounded to 1.1 billion in the slide callout). That expansion lifted Android to 81.5% of the global smartphone operating system market.
Apple's iOS ranked second with a record 192.7 million devices shipped in 2014, up 25.6% from 153.4 million units in 2013. Because Apple's 25.6% unit growth trailed Android's 32.0% surge, global iOS market share dipped by 0.3 percentage points from 15.1% in 2013 to 14.8% in 2014.
| Operating System | 2013 Unit Shipments | 2014 Unit Shipments | YoY Shipment Growth | 2014 Global OS Share | Slide Source |
|---|---|---|---|---|---|
| Android | 802.2M units | ~1.1B units (1,058.9M) | +32.0% | 81.5% | IDC (slides 3–4) |
| iOS (Apple) | 153.4M units | 192.7M units | +25.6% | 14.8% (down from 15.1% in 2013) | IDC (slides 3–4) |
| Windows Phone | Not broken out | Not broken out | +4.2% | Residual (~2.7%–3.7%) | IDC (slides 3–4) |
In third place, Windows Phone recorded 4.2% year-over-year unit growth—the smallest increase among leading platforms and well below the overall smartphone market average. On the five-year trend chart covering 2010–2014 (slide 4), Android's global share climbed steadily from roughly 23% (2010) to 49% (2011), 69% (2012), 79% (2013), and 81.5% (2014), whereas iOS hovered in the 15%–19% band and Windows Phone remained below 5%.
71% of Mobile Developers Prioritize Android as Swift Reaches 20% Adoption
Chapter 2 (slides 5–6) draws on Developer Economics surveys to track platform mindshare among full-time professional mobile developers across three consecutive waves: Q1 2014, Q3 2014, and Q1 2015.
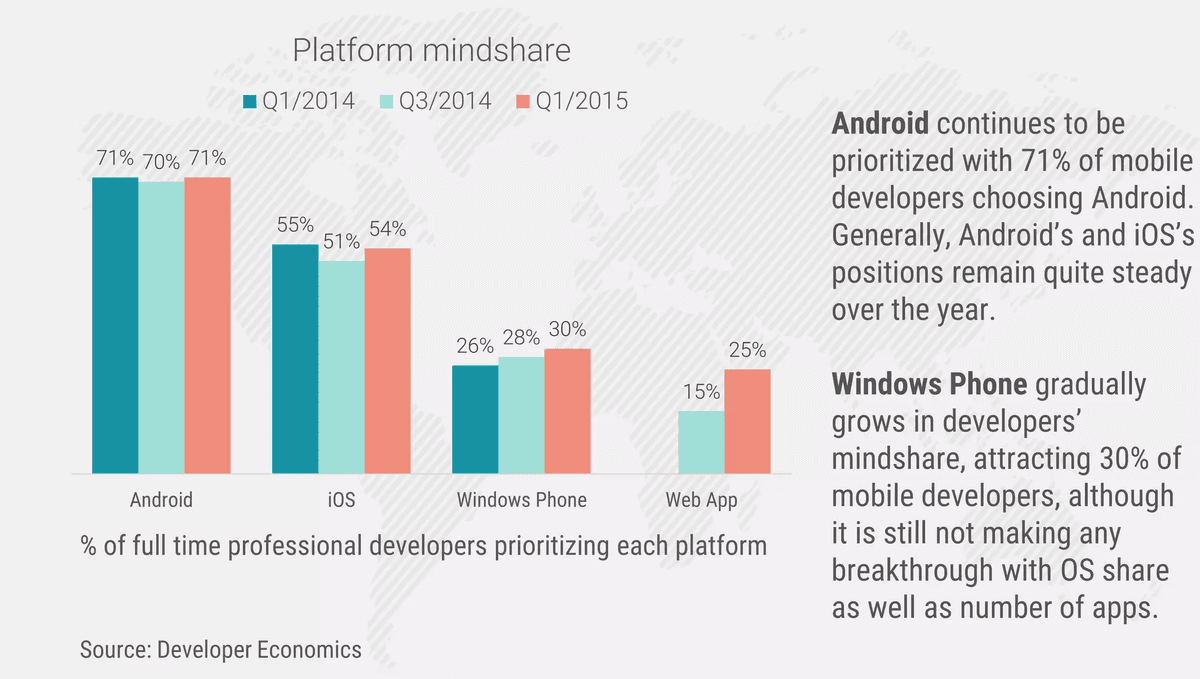
The multi-quarter series on slide 5 highlights steady commitment to the two dominant ecosystems alongside rising secondary interest in web technologies:
- Android holds the top developer mindshare: Fully 71% of professional mobile developers prioritized Android in Q1 2015, matching the 71% recorded in Q1 2014 after a brief dip to 70% in Q3 2014.
- iOS remains the second core pillar: Developer prioritization for iOS stood at 54% in Q1 2015, rebounding 3 percentage points from 51% in Q3 2014 and nearly matching its 55% level in Q1 2014.
- Windows Phone and Web Apps gain developer attention: Despite sluggish handset shipment growth, Windows Phone attracted 30% of surveyed developers in Q1 2015 (up from 26% in Q1 2014 and 28% in Q3 2014). Meanwhile, Web App prioritization jumped 10 percentage points from 15% in Q3 2014 to 25% in Q1 2015.
| Developer Economics Benchmark | Platform / Language | Q1 2014 | Q3 2014 | Q1 2015 | Operational Trend |
|---|---|---|---|---|---|
| Platform mindshare | Android / iOS | 71% / 55% | 70% / 51% | 71% / 54% | Primary duopoly remains stable YoY |
| Platform mindshare | Windows Phone / Web App | 26% / — | 28% / 15% | 30% / 25% | Growing cross-platform experimentation |
| Development language share | Java / HTML5 | — | — | 57% / 55% | Top two languages across mobile teams |
| Development language share | Objective-C / C# / C/C++ | — | — | 39% / 38% / 37% | Core native and game-engine languages |
| Development language share | Swift | — | — | 20% | Rapid uptake within months of launch |
Measured by programming language adoption on slide 6 (where developers could select multiple languages), Java ranked first at 57%, reflecting the size of the global Android developer base. HTML5 followed closely in second place at 55%, underscored by hybrid app frameworks and mobile web development.
Three established compiled languages clustered tightly in the middle tier: Objective-C (39%), C# (38%), and C/C++ (37%). The standout shift in Q1 2015 was Apple's new Swift language: within less than a year of its June 2014 unveiling, 20% of mobile developers were already using Swift. As the report notes, while Objective-C codebases will remain in production for years, investing in Swift training had already become essential for iOS engineering teams.
Google Play Overtakes App Store With 1.43 Million Apps While iOS Leads Revenue by 70%
Chapter 3 (slide 7) synthesizes AppFigures and App Annie data to contrast catalog expansion against storefront monetization in 2014.
According to AppFigures' five-year growth curve (2010–2014), the total number of available apps on Google Play expanded by more than 50% in 2014, overtaking Apple's App Store for the first time. By year-end 2014, Google Play hosted over 1.43 million available apps compared with 1.21 million on the iOS App Store—a catalog gap of 220,000 apps that the slide commentary describes as a difference of about 17%. From 2010 through 2013, Apple's catalog curve (climbing from ~0.15 million in 2010 to ~0.8 million in 2013) had consistently stayed ahead of Google Play (which rose from ~0.02 million in 2010 to ~0.7 million in 2013).
Despite Google Play's catalog lead, App Annie full-year revenue figures on slide 7 confirm that Apple retained a decisive monetization advantage. Across the entirety of 2014, iOS App Store apps generated 70% more revenue than Google Play apps, reinforcing the strategic role of iOS for direct in-app purchases and paid downloads.
How Did iOS and Android Device Fragmentation Shift in Vietnam During Q1 2015?
Chapter 4 (slides 8–11) examines domestic hardware and operating system telemetry collected across Appota's network in Vietnam through the end of Q1 2015. The dataset highlights hardware replacement cycles on iOS alongside multi-tier OS and vendor fragmentation on Android.
iPhone 5 Gains Momentum as iOS 8 Reaches 23% on iPhone and 8% on iPad
On slide 8, the six-quarter iDevice Share line chart tracks four Apple device families in Vietnam (iphone 5, iphone 4, ipad, ipod) from Q4 2013 through Q1 2015.
The trajectory shows iPhone 5 expanding steadily to become the primary growth engine among Vietnamese iOS users. Starting from roughly 17% in Q4 2013 and 18%–20.5% between Q1 and Q3 2014, iPhone 5 share climbed to roughly 28% in Q4 2014 and reached ~30% in Q1 2015. That surge pushed iPhone 5 past iPad, which peaked at roughly 37% in Q3 2014 before declining to ~30% in Q4 2014 and ~26.5%–27% in Q1 2015.
Meanwhile, legacy iPhone 4 handsets trended downward from roughly 57% in Q4 2013 and 50% in Q2 2014 to ~42% in Q1 2015, while iPod devices accounted for less than 2% of active iOS traffic.
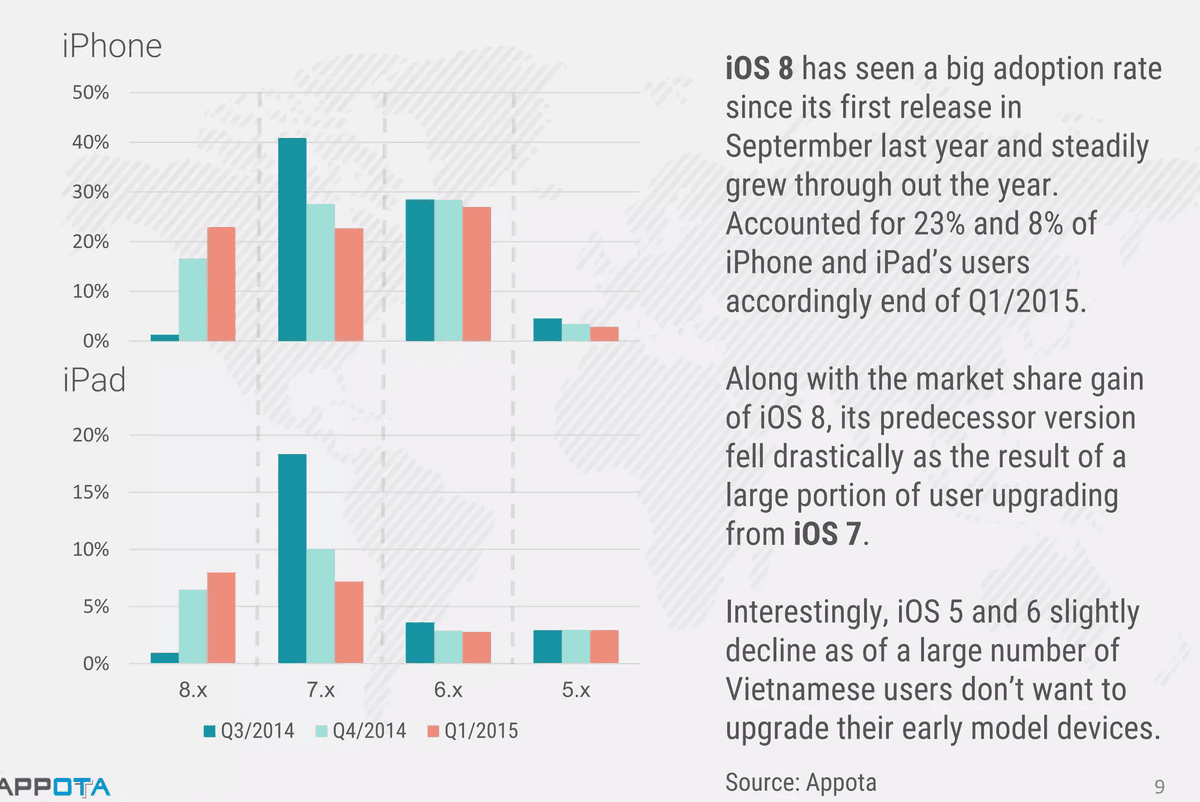
On slide 9, paired bar charts break down iOS version adoption (8.x, 7.x, 6.x, 5.x) across iPhone and iPad from Q3 2014 to Q1 2015, normalized across 100% of total iOS devices in Vietnam:
- Steady rollout of iOS 8: Following its September 2014 release (when it registered ~1%–1.5% at the close of Q3 2014), iOS 8 climbed to 23% on iPhone and 8% on iPad by the end of Q1 2015—accounting for 31% of all active iOS devices in Vietnam.
- Sharp contraction in iOS 7: Most iOS 8 adopters upgraded directly from iOS 7. On iPhone,
iOS 7.xfell from roughly 41% (Q3 2014) to 27.5% (Q4 2014) and ~23% (Q1 2015). On iPad,iOS 7.xdropped by more than half, from roughly 18.3% (Q3 2014) to 10% (Q4 2014) and ~7.2% (Q1 2015). - Persistent iOS 5 and iOS 6 holdouts: Unlike iOS 7,
iOS 6.xandiOS 5.xdeclined only marginally over the three quarters (iOS 6.xon iPhone held near 27%–28.5% and on iPad near 2.8%–3.6%, whileiOS 5.xstayed around 2.8%–4.8% on iPhone and ~2.9% on iPad). As the report notes, a large segment of Vietnamese users kept early-generation hardware (such as iPhone 4/4S and iPad 2) on iOS 5 and iOS 6 to avoid performance slowdowns.
Android KitKat Captures 54% OS Share While Samsung Leads Phones and Tablets
Across Vietnam's Android installed base on slide 10, version adoption between Q3 2014 and Q1 2015 consolidated around Android 4.4 KitKat:
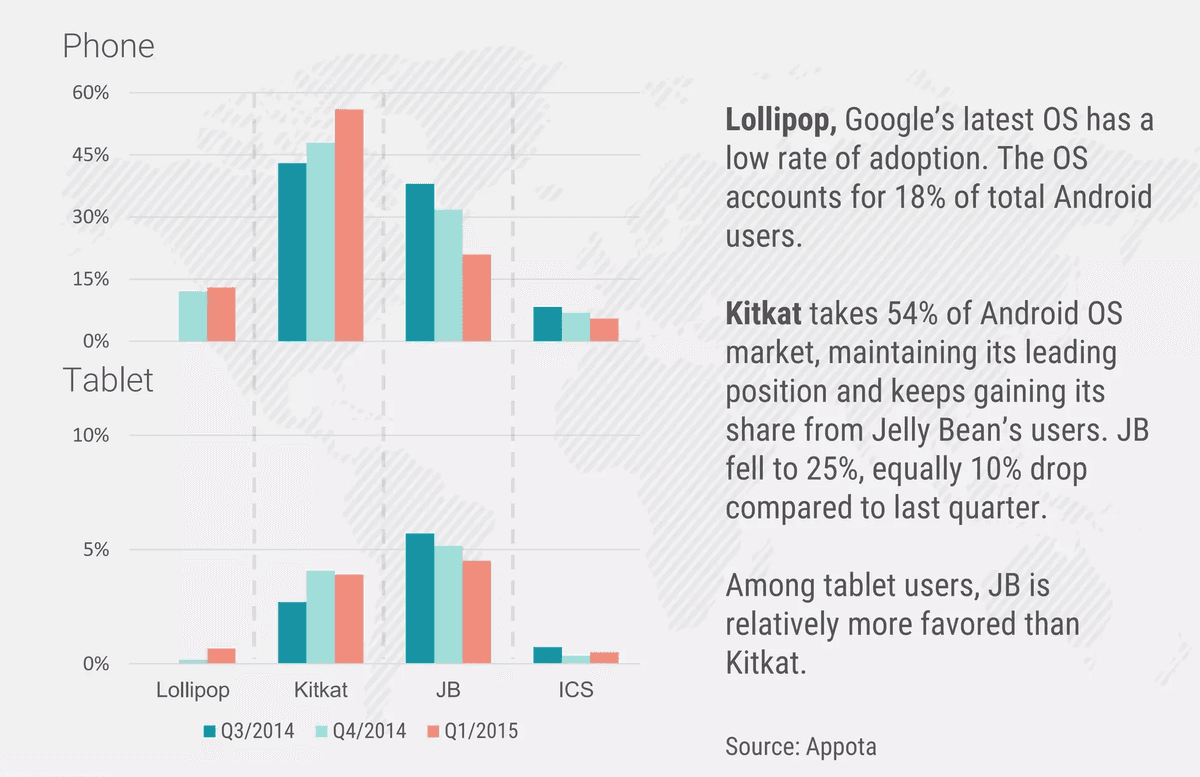
- KitKat leads with 54% market share: Per the slide 10 narrative, KitKat captured 54% of Vietnam's Android OS market in Q1 2015, expanding steadily as users migrated away from Jelly Bean.
- Jelly Bean drops 10 percentage points to 25%: Total Jelly Bean (JB) share fell to 25% in Q1 2015, representing a 10-percentage-point drop from Q4 2014 (~35%). However, among Android Tablet users specifically, the lower chart on slide 10 shows Jelly Bean (~4.5% of total Android devices) remained slightly more favored than KitKat (~3.9%).
- Lollipop reaches 18% early adoption: Google's newest release, Android 5.0 Lollipop, accounted for 18% of total Android users in the slide text (on the plotted form-factor bars, Phone Lollipop stands at roughly 13%–13.5% and Tablet Lollipop at ~0.6%), with legacy Ice Cream Sandwich (ICS) holding the remaining share.
| Vietnam Android Benchmark (Q1 2015) | OS Version / OEM Segment | Reported Share | Key Operational Takeaway |
|---|---|---|---|
| Android OS version (slide 10 text) | KitKat / Jelly Bean / Lollipop | 54% / 25% (-10 pp QoQ) / 18% | KitKat dominates phones; JB still edges out KitKat on tablets |
| Android Tablet vendors (slide 11) | Samsung / Asus / Google | 43% / 19% / 11% | Top three brands control 73% of the Android tablet base |
| Android Tablet vendors (slide 11) | Acer, Lenovo, Amazon, Sony, LG, HTC, Other | 27% (combined 7 segments) | Fragmented long tail across budget tablet models |
| Android Phone vendors (slide 11) | Samsung / Asus / LG / Other | 27% / 10% / 8% / 32% | Samsung exceeds next 5 vendors combined; severe OEM fragmentation |
| Android Phone vendors (slide 11) | Sony, Nokia, Oppo, HTC, Lenovo, Google, Acer, Amazon | 23% (combined 8 OEMs) | No individual mid-tier vendor exceeds 8% share |
On the hardware manufacturer breakdown on slide 11 (Android vendors breakdown), Samsung retained the top position by a wide margin across both form factors, attracting more users than the next five vendors combined:
- Android Tablets: Samsung captured 43% of Android tablet users in Vietnam, followed by Asus at 19% and Google (Nexus) at 11%. The remaining seven legend entries (Acer, Lenovo, Amazon, Sony, LG, HTC, and Other) accounted for the remaining 27%.
- Android Smartphones: Samsung led with 27% of Android smartphone users, ahead of Asus (10%) and LG (8%). The next eight named vendors (Sony, Nokia, Oppo, HTC, Lenovo, Google, Acer, and Amazon) represented a combined 23%, while Other manufacturers accounted for 32%. That 32% Other slice underscores severe hardware fragmentation across Android phones in Vietnam, making device compatibility testing a top priority when executing a mobile game soft launch checklist.
What Do 120 Million+ Downloads Reveal About Mobile Apps in Vietnam in Q1 2015?
Chapter 5 (slides 12–18) details domestic app download growth, category shifts, gaming sub-category leaderboards, geographic concentration, hourly download curves, and the Top 10 Vietnamese apps on iOS and Android.
Downloads Surpass 120 Million (+32% YoY) as Games Gain 16 Percentage Points
On slide 12, Appota reports that Vietnam's mobile ecosystem reached 9,000 Vietnamese apps and games and generated over 120 million app downloads (120M+ App downloads) in Q1 2015.
The indexed bar chart Total app downloads by quarters (benchmarked to Q1/2014 = 100%) tracks accelerating installation volume across Vietnam:
- Q1 to Q4 2014 growth (
15% Q1-Q4 growth): Quarterly download volume rose 15% from an index of 100% in Q1 2014 to 115% in Q4 2014. - Year-over-year growth (
32% y-o-y growth): By Q1 2015, the quarterly download index climbed to 132%, representing a 32% year-over-year expansion compared with Q1 2014 (and roughly 14.8% quarter-over-quarter growth above Q4 2014).
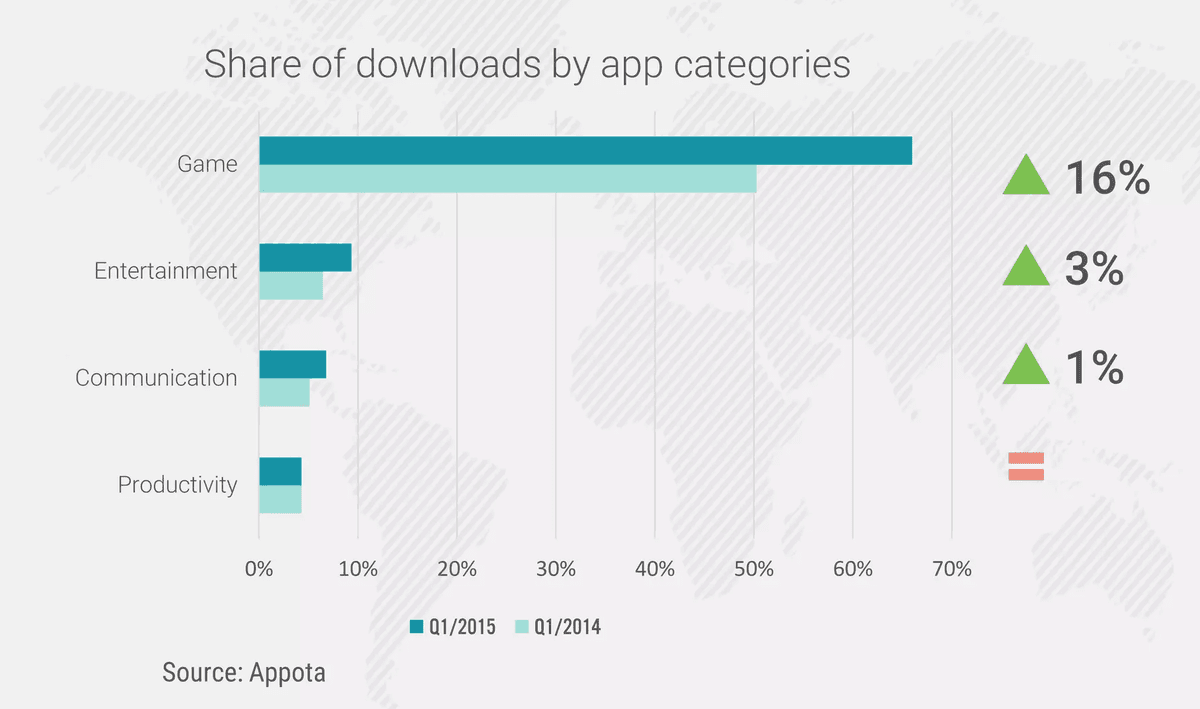
Breaking down downloads by category on slide 13 (Share of downloads by app categories) shows mobile gaming driving the vast majority of year-over-year expansion:
- Game: Surged by +16% (16 percentage points) year-over-year, climbing from roughly 50% of all downloads in Q1 2014 to ~66% (nearly two-thirds of total installs) in Q1 2015.
- Entertainment: Rose by +3% (3 percentage points), expanding from roughly 6.5% in Q1 2014 to ~9.5% in Q1 2015.
- Communication: Increased by +1% (1 percentage point), edging up from roughly 5.5% in Q1 2014 to ~6.5%–7% in Q1 2015.
- Productivity: Remained unchanged (
=) at approximately 4.5% of downloads across both Q1 2014 and Q1 2015.
Gaming Leaderboard: Action and Arcade Sub-Categories Dominate Supply and Installs
Examining the gaming vertical in detail, the Gaming Leaderboard bubble chart on slide 14 maps all game sub-categories by Downloads (millions) on the horizontal axis (0 to 35 million) against Number of apps (thousands) on the vertical axis (0 to 9 thousand).
Three labeled sub-categories stood far above the rest of the market:
- Action Games: Generated the highest installation volume in Vietnam, with its bubble centered around ~28 million downloads (spanning 25M–31M on the x-axis) across roughly 6,800 games (~6.8 thousand apps on the y-axis).
- Arcade Games: Led total catalog supply with roughly 7,400 games (~7.4 thousand apps) and ranked second in installations at ~18.3 million downloads.
- Adventure Games: Ranked third among labeled genres with roughly 10.2 million downloads across ~3,700 games (~3.7 thousand apps).
Seven additional unlabeled game sub-categories clustered in the lower-left quadrant between 0.8 million and 7.5 million downloads and 400 to 4,900 apps per genre, confirming that Vietnamese players heavily favored fast-paced Action and Arcade titles.
Hanoi and Ho Chi Minh City Exceed 60% of Installs With an 18:00–22:30 Evening Peak
Slides 15 and 16 provide geographic and temporal benchmarks for user acquisition campaigns in Vietnam.
On slide 15 (App downloads by cities), Appota's geographic density map shows that Hanoi and Ho Chi Minh City account for more than 60% of total app downloads nationwide. Secondary coastal and delta clusters appear in Hai Phong, Da Nang, Nha Trang, Can Tho, and provinces bordering the two metropolitan hubs.
On slide 16 (Popular time for downloads), joint telemetry from InMobi and Appota compares 24-hour download curves (0 to 24 hours) across Vietnam, Indonesia, and China:
- Consistent regional evening behavior: Across all three Asian markets, download activity falls to a daily trough between
03:00and05:00, crosses above the horizontal daily Average line around07:00–09:00, reaches a secondary midday peak between12:00and14:30, dips modestly around16:00, and climbs to its highest daily peak in the evening. - Prime user acquisition window (
18:00–22:30): The dashed highlight box (Best time to reach users) spans 18:00 to roughly 22:30. Both Vietnam and Indonesia peak around 20:00–21:00, while China exhibits an even sharper late-evening spike around 21:30–22:00.
Comparing the Top 10 Downloaded Vietnamese Apps on iOS and Android
Slides 17 and 18 list the 10 most downloaded Vietnamese apps and games on Appota's platform across iOS and Android during Q1 2015. Teams planning mobile game publishing in Vietnam can compare cross-platform user demand in the table below.
| Display Order | Top 10 Vietnamese iOS Apps (Slide 17) | Top 10 Vietnamese Android Apps (Slide 18) | Category & Genre Profile |
|---|---|---|---|
| 1 | I am Naruto | Hiep Khach (Hiệp Khách) | Manga card RPG / Martial-arts RPG |
| 2 | MobiTivi | Thien Than Truyen (Thiên Thần Truyện) | Mobile TV streaming / Mythological RPG |
| 3 | Au Mobile | Mobi TV (MobiTivi) | Casual rhythm & dance game / Mobile TV streaming |
| 4 | Vua Bong Da (Vua Bóng Đá) | Bingota | Football management game / Casual board & card game portal |
| 5 | NCT (NhacCuaTui) | Tieu Su Muoi (Tiểu Sư Muội) | Online music streaming / Chibi martial-arts RPG |
| 6 | MILLIONARTHUR (Million Arthur) | LMHT Mobile | Card battle RPG (with onClan badge) / MOBA-inspired strategy RPG |
| 7 | Hiep Khach (Hiệp Khách) | NCT (NhacCuaTui) | Martial-arts RPG / Online music streaming |
| 8 | LMHT Mobile | I am Naruto | MOBA-inspired strategy game / Manga card RPG |
| 9 | Tom cua ca (Tôm Cua Cá) | UC Browser | Traditional folk casual game / Mobile web browser |
| 10 | 24h quoc chien (24h Quốc Chiến) | 24h quoc chien (24h Quốc Chiến) | Real-time nation-warfare RPG |
Three product patterns stand out across the two leaderboards:
- Six cross-platform hits appear on both charts: Four mobile games (I am Naruto, Hiệp Khách, LMHT Mobile, and 24h Quốc Chiến) and two media streaming apps (MobiTivi / Mobi TV and NCT - NhacCuaTui) ranked in the Top 10 on both iOS and Android simultaneously.
- Games occupy 70%–80% of top downloads: Mobile games claimed 8 of the 10 iOS slots (adding Au Mobile, Vua Bóng Đá, Million Arthur, and Tôm Cua Cá) and 7 of the 10 Android slots (adding Thiên Thần Truyện, Bingota, and Tiểu Sư Muội alongside utility browser UC Browser).
- Strong traction for Manga, Martial Arts, MOBA, and Football IP: Alongside classic martial-arts RPGs, titles leveraging Naruto IP, League of Legends (LMHT Mobile) themes, and domestic football passion (Vua Bóng Đá and MobiTivi's national-team icon) drove top organic installation volume.
How Did Appota's 13-Million-User Ecosystem Support Mobile Developers?
The final chapter (slides 19–21) outlines Appota's content distribution ecosystem and developer partnership programs in Q1 2015.
By Q1 2015, Appota's mobile content distribution platform connected developers and game publishers with smartphone communities across Southeast Asia, where Vietnam accounted for 13 million users (slide 20). The Appota Ecosystem tree diagram encompasses eight integrated pillars: Mobile application store, Publishing services, Mobile ads network, Social network for mobile gamers, Mobile game review portal, Social Communities, Affiliate Tools for mobile communities, and Mobile managing tool for PC.
Three core platforms anchored Appota's developer offering in Q1 2015:
- onClan: A social mobile gaming platform focused on increasing player-to-player engagement, guild communication, and in-game community retention (visibly integrated into titles such as Million Arthur on slide 17).
- Gamehub.vn: A dedicated editorial review and news portal specialized for mobile gaming in Vietnam.
- Applancer (
applancer.net): A global mobile outsourcing marketplace connecting clients with freelance mobile developers. During Q1 2015, Applancer launched the Applancer Referral Program (https://applancer.net/referrals/, slide 19), offering referrers a reward of up to 50% of the project bid.
Four Strategic Priorities for Mobile App and Game Publishers in Vietnam
Synthesizing Appota's Q1 2015 telemetry yields four actionable priorities for engineering, product, and publishing teams operating in Vietnam:
- Begin Swift Migration While Maintaining iOS 6 Backward Compatibility: With 20% of global developers adopting Swift, 31% of Vietnamese iOS devices running
iOS 8.x(23% iPhone, 8% iPad), and iPhone 5 reaching ~30% share, studios should adopt Swift for new modules while ensuring builds remain compatible with legacyiOS 6.xdevices (~30% of iOS users) and iPhone 4/4S viewports (~42%). - Center Android QA on KitKat 4.4 and Samsung/Asus Hardware: Because KitKat holds 54% of Vietnam's Android market (ahead of Jelly Bean at 25% and Lollipop at 18%) and Samsung (27% Phone, 43% Tablet) plus Asus (10% Phone, 19% Tablet) lead device share, QA matrices should prioritize these configurations while testing Jelly Bean specifically for Android tablet releases.
- Concentrate User Acquisition in Hanoi and HCMC During the 18:00–22:30 Window: Because Hanoi and Ho Chi Minh City generate over 60% of national downloads and installation volume peaks between 18:00 and 22:30 (cresting at 20:00–21:00), scheduling ad bursts and push notifications during evening hours maximizes conversion for Action (~28M downloads) and Arcade (~18.3M downloads) titles.
- Combine Google Play Scale With iOS Monetization Infrastructure: With Google Play surpassing 1.43 million apps and iOS generating 70% more revenue, publishers should use Android and community hubs like onClan and Gamehub.vn for broad user acquisition while optimizing iOS in-app billing flows using a structured payment gateway integration checklist.
Sources
- State of mobile apps in Vietnam Q1/2015 (Vietnam Mobile Report Q1 2015), Công ty Cổ phần Appota (Appota Group), 2015-04-10, accessed 2026-11-02
- Worldwide Smartphone OS Market Share & Shipment Volume (2010–2014), International Data Corporation (IDC), 2015-02-24, accessed 2026-11-02
- Developer Economics Q1 2015: State of the Developer Nation (Platform Mindshare & Development Languages), Developer Economics (VisionMobile, nay là SlashData), 2015-03-01, accessed 2026-11-02
- App Stores Growth in 2014 — Total Available Apps & Store Revenue Comparison, AppFigures & App Annie (nay thuộc Sensor Tower), 2015-01-20, accessed 2026-11-02
- Popular Time for Mobile App Downloads Across Vietnam, Indonesia & China (Q1 2015), InMobi & Appota, 2015-04-10, accessed 2026-11-02
- Hệ thống phân phối nội dung di động Appota và mạng lưới onClan, Gamehub.vn, Applancer (Quý 1/2015), Công ty Cổ phần Appota (Appota Group), 2015-04-10, accessed 2026-11-02