
Vietnam Mobile Market Report Q1 2016
Appota's Vietnam mobile market report for Q1 2016 benchmarks 45M+ domestic Internet users and 34M+ smartphones against global behavioral and ad-spend data. Vietnam recorded 23M+ Android devices, 52 new mobile game releases, an 86% Tết mobile shopping surge, Google Play–Viettel carrier billing, and MoMo's $28M funding.
Appota's Q1 2016 Vietnam mobile market report: 45M+ Internet users, 34M+ smartphones, 23M+ Android devices, 52 new mobile games, Tết mobile shopping (+86%), Google Play–Viettel billing, and MoMo's $28M round.
Key findings
- 1.9B smartphones & 82.0% AndroidAs of Q1 2016, the world's 7.4 billion population included 4.5 billion mobile phone users and 1.9 billion smartphone users at an average of 1.4 mobile devices per person; Android led global smartphone OS share at 82.0%, ahead of iOS (15.1%), Windows Phone (1.6%), and Other (1.3%) (GlobalWebIndex, Appota).
- 150–200 pickups & 3.25+ hrs/dayGlobally, 73% of people always kept their mobile device with them, picking it up 150 to 200 times daily for an average session of 1 minute 10 seconds (177 minutes/day); 75% of Internet users went online via mobile for an average of 2.08 hours/day, rising to 3.25+ hours/day among ages 16–24 (GlobalWebIndex).
- 80% In-App & 43.26% iOS ad spendIn-app Ads captured 80% of global mobile ad spending in Q1 2016 versus 20% for Mobile Web Ads (86% In-app in EMEA and 79% in both the Americas and APAC); Android accounted for 54.93% of global mobile ad spend and iOS took 43.26%, with iOS reaching 46.69% across APAC (Smaato).
- 45M+ Internet & 34M+ smartphonesVietnam surpassed 45 million Internet users (48% female, 52% male) and 34 million smartphone devices (62% Android, 28% iOS, 6% Windows Phone, 4% Other); 57% of Vietnamese under age 44 used a smartphone, led by ages 25–34 (63%) and under 25 (62%) (GlobalWebIndex, Appota).
- 23M+ Android & 25% on 4.4.2Total active Android devices in Vietnam exceeded 23,000,000 units, led by Android 4.4.2 (25%), Android 5.1.1 (11.70%), and Android 4.4.4 (11.40%); by screen resolution, WVGA 480x800 (28.71%) and HD 720x1280 (26.12%) accounted for more than half of the top five resolutions (Appota).
- 52 new games & 2.9M Piano installsFifty-two mobile games debuted in Vietnam during Q1 2016, led by RPGs (25 titles), Card Battle (10), and Casino (8); on local app stores, Piano Tiles 2 reached 2.9 million installs (2.3M on Google Play, 600k on the App Store) while Analog Camera Apps occupied all top 10 Paid App Store spots (Appota).
- 4.2x mobile content & +86% TếtDuring Vietnam's Tết Lunar New Year holiday (February 2016), mobile content creation was 4.2x higher than on desktop (with 37% more videos, 23% more photos, and 16% more blogs posted than on an average day); mobile shopping jumped 86% and peaked on Fridays (Facebook).
- 10% DCB fee & $28M MoMo roundThree Q1 2016 milestones shaped Vietnam's 2016 mobile outlook: Google Play launched direct carrier billing with Viettel (+10% end-user fee, unchanged 70/30 developer split), MoMo raised $28M as e-commerce hit $4B (+20%/year), and Hachi commercialized Vietnam's first startup IoT product (Appota, MOIT).
How Did Global User Behavior and Ad Spending Shape the Vietnam Mobile Market in Q1 2016?
Published on April 7, 2016 by Appota Joint Stock Company (Appota Group), the Q1 2016 Vietnam mobile market report (Vietnam Mobile Report Q1/2016) captures a structural turning point from smartphone hardware adoption toward digital monetization, direct carrier billing, and commercial Internet of Things (IoT) services. Across 22 slides, the study combines primary Q1 2016 device and publishing telemetry from Appota's ecosystem—tracking more than 23 million active Android devices in Vietnam—with research from GlobalWebIndex, the Smaato Publisher Platform, Facebook, and Vietnam's Ministry of Industry and Trade.
Readers following our Gaming research can compare these benchmarks against the Vietnam Mobile Apps Report Q3 2015 to see how publisher priorities shifted from raw install volume to in-app monetization. Chapter 1 of the presentation (slides 3–11) establishes the global baseline across smartphone penetration, daily micro-session habits, generational and regional usage gaps, and mobile ad-spend allocation.
1.9 Billion Global Smartphone Users, 1.4 Devices per Person, and an 82.0% Android Share
According to slide 4 (Global OS), out of a 7.4 billion world population (7.4B World Population), the global mobile ecosystem in Q1 2016 encompassed 4.5 billion mobile phone users (60.81% of the global population) and 1.9 billion smartphone users (25.68% of the total population and 42.22% of mobile phone users). Across the entire planet, consumers owned an average of 1.4 mobile devices per person (1.4 Device Per person on the planet).
On the global operating system semi-donut chart on slide 4, Android commanded an 82.0% market share, followed by Apple's iOS at 15.1%, Windows Phone at 1.6%, and Other operating systems at 1.3%.
| Global Mobile & OS Metric (Slides 4–6) | Q1 2016 Reported Value | Share / Operational Context | Source |
|---|---|---|---|
| World Population | 7.4 billion | Average of 1.4 mobile devices per person | Appota & GWI (slide 4) |
| Mobile Phone Users | 4.5 billion | 60.81% of global population | Appota & GWI (slide 4) |
| Smartphone Users | 1.9 billion | 42.22% of mobile phone users | Appota & GWI (slide 4) |
| Global Smartphone OS Share | Android 82.0% · iOS 15.1% | Windows Phone 1.6% · Other 1.3% | Appota & GWI (slide 4) |
| Device Attachment & Pickup Frequency | 73% always carry device | 150 to 200 device pickups per day | GlobalWebIndex (slide 5) |
| Session Length & Mobile Online Time | 1 min 10 sec per session | 177 mins/day total sessions; 2.08 hrs/day online (75% users) | GlobalWebIndex (slide 6) |
150–200 Daily Device Pickups and 3.25+ Hours of Daily Mobile Internet Usage Among Ages 16–24
From slide 5 through slide 9, Q1 2016 survey data from GlobalWebIndex quantifies how deeply smartphones became embedded in daily routines:
- High-frequency micro-sessions (slides 5–6): Fully 73% of people always kept their mobile device with them and picked up their phone 150 to 200 times a day. Individual mobile sessions averaged 1 minute 10 seconds, adding up to 177 minutes per day (~151.7 sessions/day). Meanwhile, 75% of Internet users went online via a mobile device, logging an average Time Spent Online of 2.08 hours/day.
- Generational curve in daily mobile phone time (slide 7): Young adults aged 16 to 24 spent an average of 3.25+ hours per day (
3.25h) online on a mobile phone—nearly five times the oldest cohort. Daily mobile internet time stepped down steadily across older brackets: 2.68 hours for ages 25–34, 1.83 hours for ages 35–44, 1.14 hours for ages 45–54, and 0.67 hours (~40 minutes) for ages 55–64. - Emerging markets lead regional mobile engagement (slide 9): Daily mobile usage was substantially higher in emerging mobile-first regions than in mature desktop markets. Latin America led globally at 3.65 hours per day, closely followed by the Middle East at 3.45 hours per day and Asia-Pacific at 2.55 hours per day. By contrast, North America (1.84 hours/day) and Europe (1.57 hours/day) lagged behind.
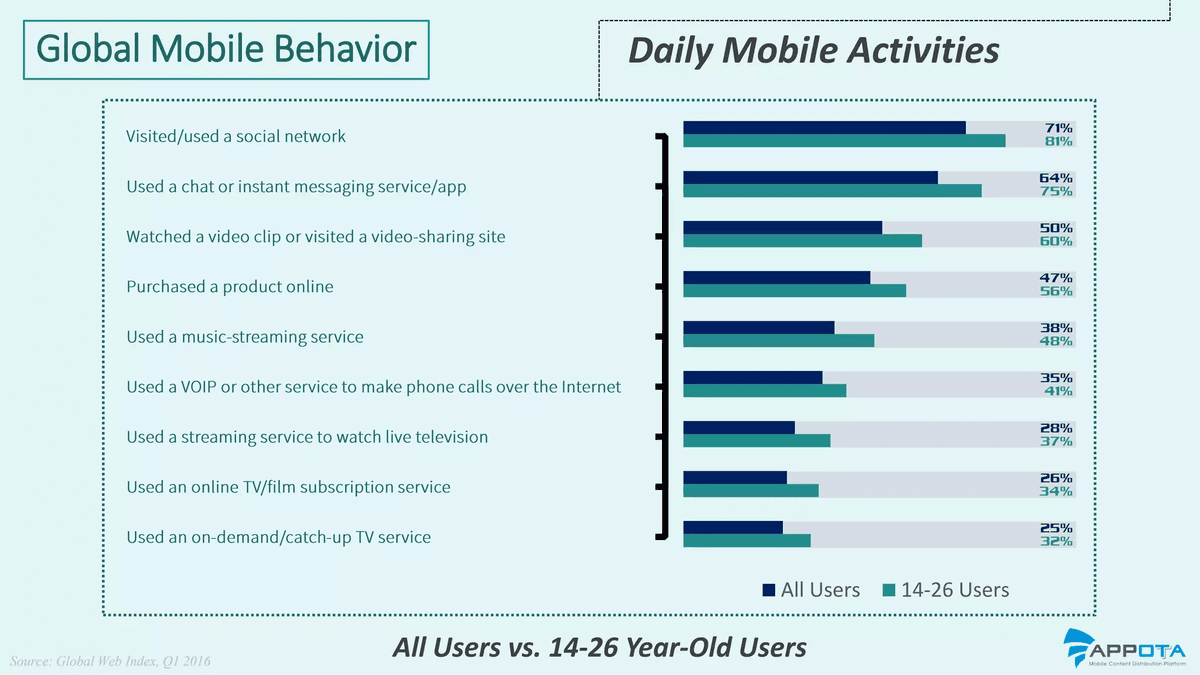
On slide 8 (Daily Mobile Activities: All Users vs. 14-26 Year-Old Users), 14–26 year-old users outpaced the overall user average (All Users) by 6 to 11 percentage points across all nine daily mobile activities:
- Visited/used a social network: 81% among ages 14–26 versus 71% across all users (+10 percentage points).
- Used a chat or instant messaging service/app: 75% among ages 14–26 versus 64% overall (+11 percentage points).
- Watched a video clip or visited a video-sharing site: 60% among ages 14–26 versus 50% overall (+10 percentage points).
- Purchased a product online: 56% among ages 14–26 versus 47% overall (+9 percentage points).
- Used a music-streaming service: 48% among ages 14–26 versus 38% overall (+10 percentage points).
- Used a VOIP or other service to make phone calls over the Internet: 41% among ages 14–26 versus 35% overall (+6 percentage points).
- Used a streaming service to watch live television: 37% among ages 14–26 versus 28% overall (+9 percentage points).
- Used an online TV/film subscription service: 34% among ages 14–26 versus 26% overall (+8 percentage points).
- Used an on-demand/catch-up TV service: 32% among ages 14–26 versus 25% overall (+7 percentage points).
In-App Ads Capture 80% of Global Mobile Spend While iOS Attracts 46.69% of APAC Ad Budgets
Slides 10 and 11 cite Q1 2016 benchmarks from the Smaato Publisher Platform to break down global mobile advertising expenditure by environment and operating system.
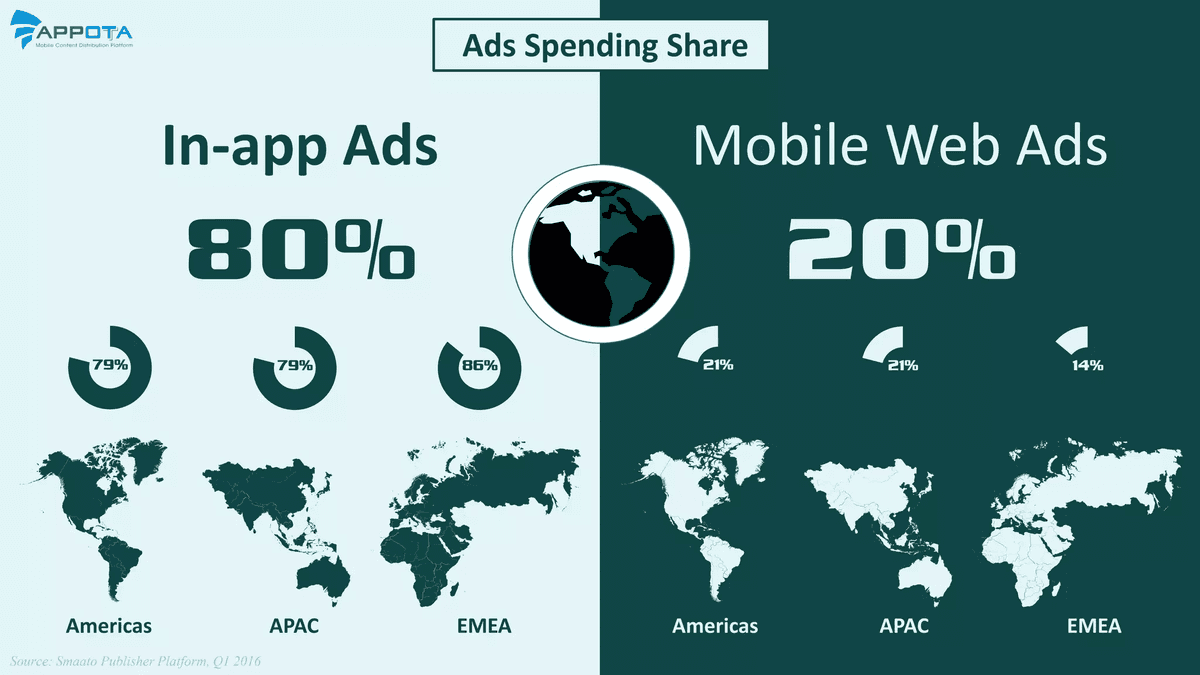
Worldwide (slide 10), In-app Ads captured 80% of mobile advertising spend, four times the 20% share of Mobile Web Ads. Regionally, EMEA recorded the highest in-app concentration at 86% In-app Ads versus 14% Mobile Web Ads, while both the Americas and APAC split at 79% In-app Ads and 21% Mobile Web Ads.
| Region | In-app Ads / Mobile Web Ads (Slide 10) | Android Spend (Slide 11) | iOS Spend (Slide 11) | Windows Phone (Slide 11) | BlackBerry (Slide 11) |
|---|---|---|---|---|---|
| Global Total | 80% / 20% | 54.93% | 43.26% | 1.67% | 0.14% |
| Americas | 79% / 21% | 56.13% | 42.79% | 1.03% | 0.06% |
| APAC | 79% / 21% | 51.70% | 46.69% | 1.47% | 0.14% |
| EMEA | 86% / 14% | 51.60% | 43.70% | 4.25% | 0.45% |
Slide 11 (Ads Spending by Mobile OS) highlights a crucial monetization asymmetry: although iOS held just 15.1% of global smartphone users (slide 4), Apple devices attracted 43.26% of global mobile ad spending—compared with 54.93% for Android, 1.67% for Windows Phone, and 0.14% for BlackBerry. Even more strikingly, in APAC, iOS captured 46.69% of mobile ad spending against 51.70% for Android, underscoring premium eCPMs and strong advertiser demand for iOS audiences across Asia.
How Were 34M+ Smartphones, 23M+ Android Devices, and 52 New Games Distributed in the Vietnam Mobile Market?
Chapter 2 (slides 12–16) drills into domestic user demographics, Android version and screen fragmentation, storefront growth strategies, and Q1 2016 game publishing activity across the Vietnam mobile market.
Over 45 Million Internet Users, 34 Million Smartphones, and 57% Smartphone Adoption Under Age 44
Combining Q1 2016 data from GlobalWebIndex and Appota on slide 13, Vietnam's connected population reached two major scale milestones:
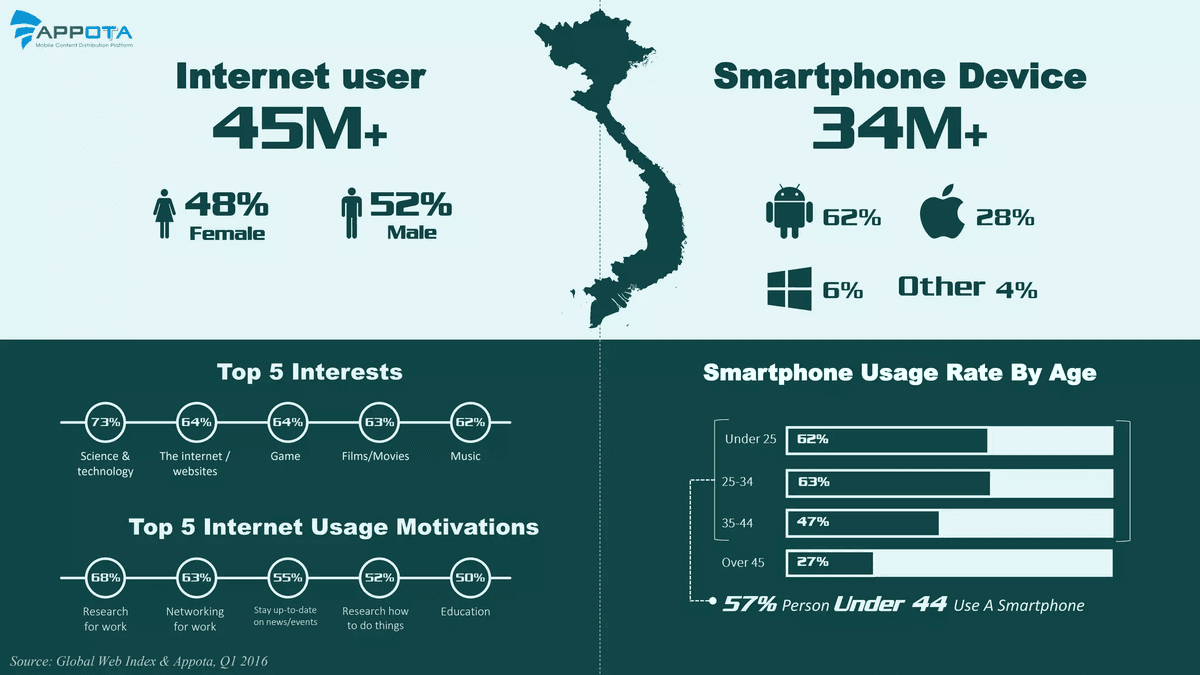
- 45M+ Internet users: Gender distribution was nearly even at 48% Female and 52% Male.
- 34M+ Smartphone devices: By operating system, Android accounted for 62%, iOS held 28% (nearly double Apple's 15.1% global share), Windows Phone took 6%, and Other platforms represented 4%.
- Smartphone usage rate by age: Penetration peaked among ages 25–34 at 63% and Under 25 at 62%, followed by ages 35–44 at 47% and Over 45 at 27%. Overall, 57% of people under age 44 in Vietnam used a smartphone.
Slide 13 also ranks the Top 5 Interests and Top 5 Internet Usage Motivations among Vietnamese Internet users:
| Rank | Top 5 Interests in Vietnam | Share | Top 5 Internet Usage Motivations | Share |
|---|---|---|---|---|
| 1 | Science & technology | 73% | Research for work | 68% |
| 2 | The internet / websites | 64% | Networking for work | 63% |
| 3 | Game | 64% | Stay up-to-date on news/events | 55% |
| 4 | Films/Movies | 63% | Research how to do things | 52% |
| 5 | Music | 62% | Education | 50% |
23M+ Active Android Devices Led by Android 4.4.2 (25%) and WVGA/HD Screens (54.83%)
On slide 14, Appota telemetry shows Vietnam's active Android installed base surpassing 23,000,000 devices (TOTAL ANDROID DEVICES: 23,000,000+). Engineering teams executing a mobile game soft launch checklist can use the OS and screen-resolution distributions below to configure their device testing matrices:
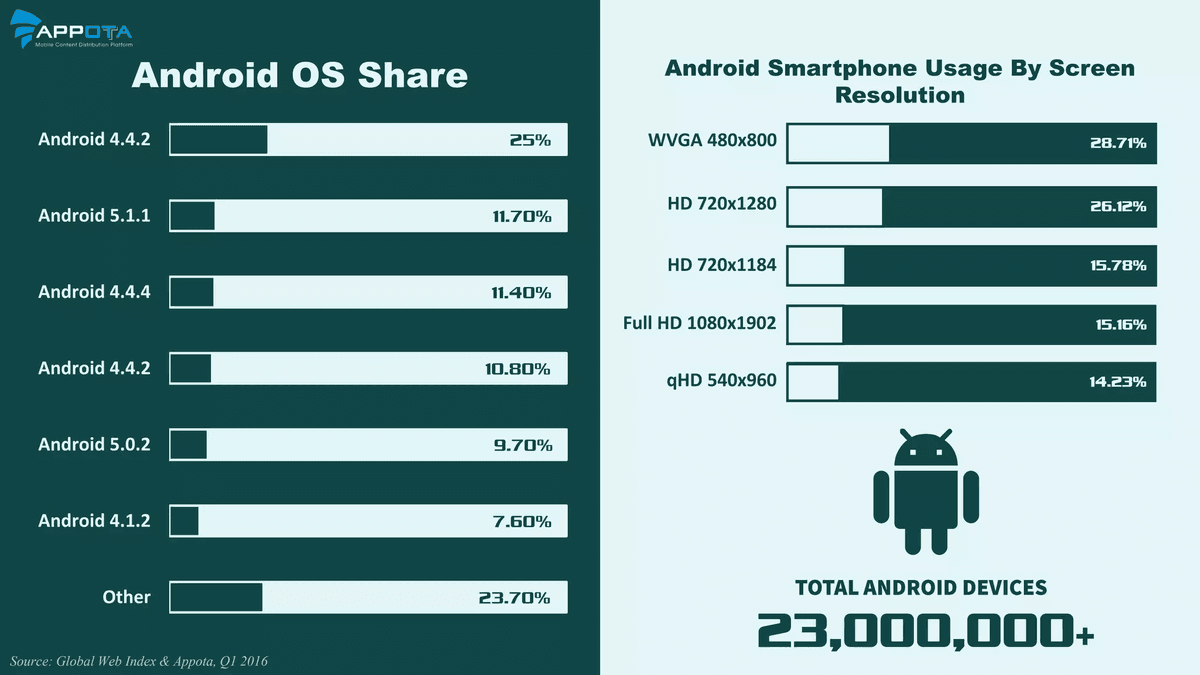
- Android OS Share (slide 14 left): Android 4.4.2 led with 25% of all domestic Android devices, followed by Android 5.1.1 (11.70%), Android 4.4.4 (11.40%), a fourth bar also labeled Android 4.4.2 at 10.80% (a duplicate label on the original slide, representing a Jelly Bean branch such as 4.2.2/4.3), Android 5.0.2 (9.70%), Android 4.1.2 (7.60%), and Other builds at 23.70% (summing to 99.90%). Combined Lollipop builds (5.1.1 and 5.0.2) reached 21.40%, while KitKat and Jelly Bean still powered the majority of budget and mid-range handsets.
- Android Smartphone Usage By Screen Resolution (slide 14 right): Normalized across the top five screen resolutions, entry-level WVGA 480x800 ranked first at 28.71%, followed closely by HD 720x1280 at 26.12%. The remaining top tiers were HD 720x1184 (15.78%), Full HD 1080x1902 (15.16%, corresponding to 1080x1920 minus soft navigation keys), and qHD 540x960 (14.23%). Together, the two 720p HD variants (
720x1280and720x1184) represented 41.90% of top-five Android displays.
Three Storefront Growth Strategies for Global Apps and 52 New Mobile Games Debuting in Q1 2016
Slides 15 and 16 examine how international app developers and local game publishers scaled user acquisition and monetization in Vietnam during Q1 2016:
On slide 15 (Global Apps Rise in Vietnam Store using different strategies), Appota highlights three distinct growth playbooks on the Vietnam Apple App Store and Google Play:
- City-localized app replication by Analog Camera Apps: The Analog Camera Apps series occupied all top 10 spots on the Apple App Store Paid chart in Vietnam (with the screenshot showing #1 Analog Tokyo, #2 Analog Paris, #3 Analog London, #4 Analog Jeju, and #5 Analog Budapest). By releasing separate $0.99 apps tailored to different city filter aesthetics, the developer motivated photography enthusiasts to purchase multiple apps to complete the filter collection.
- Global creator marketing plus localized ASO by Piano Tiles 2: Cheetah Mobile's Piano Title 2 (Piano Tiles 2) generated 600,000 installs on the App Store and 2.3 million installs on Google Play in Vietnam (2.9 million combined installs). Intuitive tap gameplay, a high-visibility collaboration with YouTube creator PewDiePie, and localized App Store Optimization (ASO) propelled its rapid nationwide adoption.
- Franchise IP recycling by Supercell's Clash Royale: Real-time strategy card battler Clash Royale surged up both the top-downloads and top-grossing charts on the Vietnam Apple App Store by reusing beloved character IP from Clash of Clans (COC).
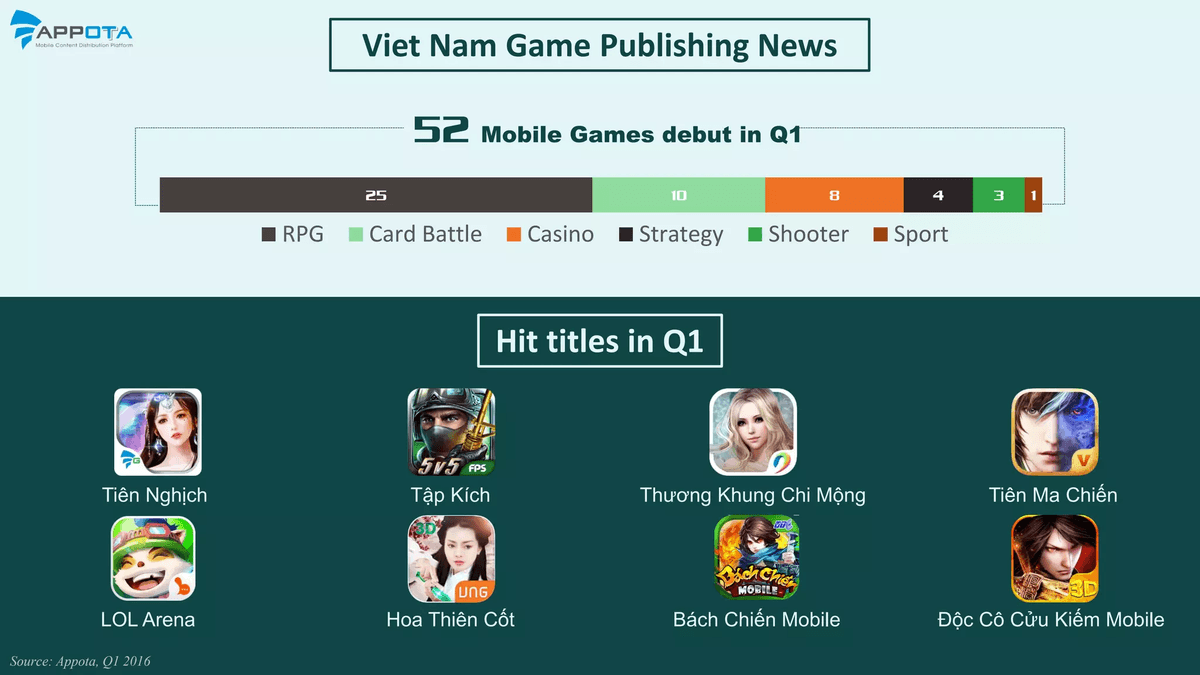
On slide 16 (Viet Nam Game Publishing News), Appota recorded 52 mobile games debuting in Vietnam in Q1 2016 (averaging four new commercial releases per week). Studios planning mobile game publishing in Vietnam can review the genre breakdown and the eight flagship releases (Hit titles in Q1) below:
| Q1 2016 Game Genre | Titles Released (Slide 16) | Share of 51 Labeled Units (of 52 Headline) | Eight Q1 2016 Hit Titles (Slide 16 Showcase) |
|---|---|---|---|
| RPG (Role-Playing) | 25 games | 49.02% (48.08% of 52) | Tiên Nghịch (Gamota) · Thương Khung Chi Mộng (VNG) |
| Card Battle | 10 games | 19.61% (19.23% of 52) | Tiên Ma Chiến (VTC Game) · Hoa Thiên Cốt 3D (VNG) |
| Casino | 8 games | 15.69% (15.38% of 52) | Bách Chiến Mobile (VTC Mobile) · Độc Cô Cửu Kiếm Mobile 3D |
| Strategy | 4 games | 7.84% (7.69% of 52) | LOL Arena (SohaGame) |
| Shooter | 3 games | 5.88% (5.77% of 52) | Tập Kích (5v5 FPS — VTC Mobile) |
| Sport | 1 game | 1.96% (1.92% of 52) | (Six labeled segments sum to 51 games vs. 52 in headline) |
RPGs accounted for nearly half of all new launches (25 titles), and together with Card Battle (10 titles) and Casino (8 titles) represented over 82% of Q1 releases. Alongside six 3D martial-arts and fantasy RPG hits (Tiên Nghịch, Thương Khung Chi Mộng, Tiên Ma Chiến, Hoa Thiên Cốt, Bách Chiến Mobile, and Độc Cô Cửu Kiếm Mobile), the breakout success of 5v5 mobile FPS Tập Kích and MOBA-inspired LOL Arena signaled rising demand for competitive mobile eSports titles in Vietnam.
How Did Tết Lunar New Year Accelerate Mobile Content Creation and Mobile Shopping in Vietnam?
Chapter 3 (slide 17) presents a dedicated seasonal case study (Case Study: Tết and Mobile) based on February 2016 Facebook data, measuring how Vietnamese user behavior shifted during the Lunar New Year holiday.
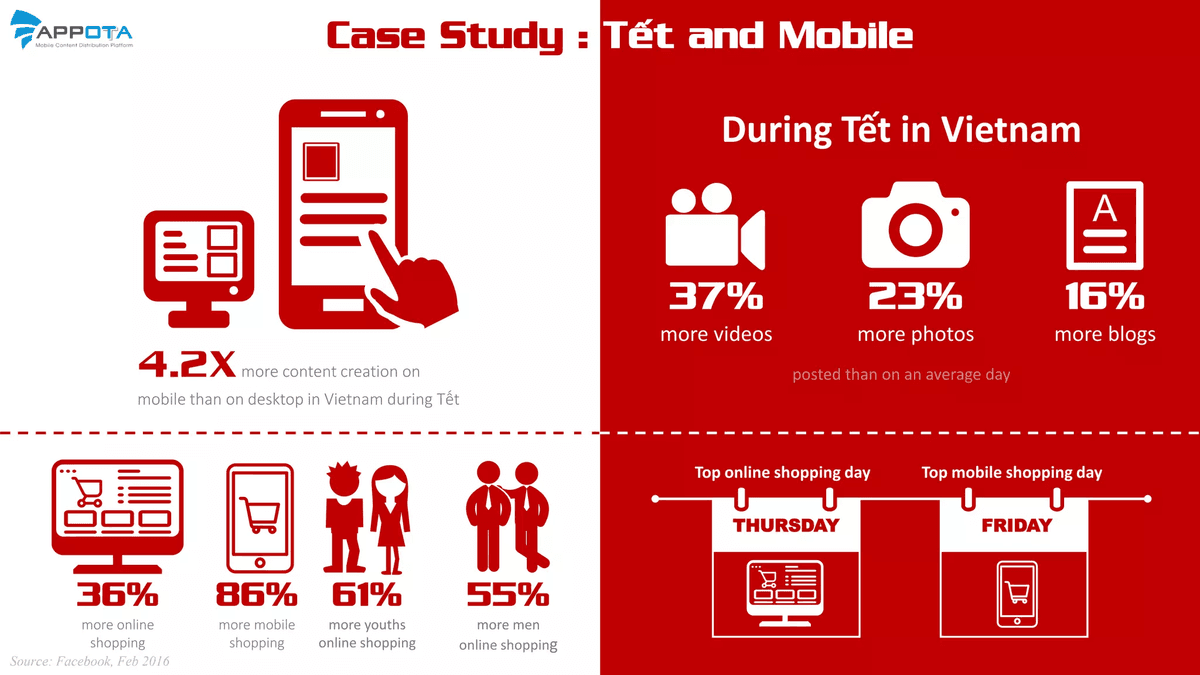
As tens of millions of Vietnamese traveled home for Tết away from desktop computers, smartphones became the primary screen for social sharing and holiday commerce:
- 4.2x more content creation on mobile than on desktop: During Tết in Vietnam, users posted 37% more videos, 23% more photos, and 16% more blogs than on an average day.
- 86% surge in mobile shopping: While overall online shopping during Tết rose by 36%, mobile shopping jumped 86%—more than double the overall online commerce growth rate. Demographically, Tết drove 61% more youths and 55% more men to shop online.
- Distinct weekly peaks for online versus mobile commerce: Facebook's transaction timeline shows Thursday (
THURSDAY) was the Top online shopping day overall, whereas Friday (FRIDAY) was the Top mobile shopping day as users transitioned into weekend and holiday travel.
Which Three Q1 2016 Events Redefined Mobile Payments, Carrier Billing, and IoT in Vietnam?
Chapter 4 (slides 18–22) examines three watershed developments in Q1 2016 across telecom carrier billing, Fintech venture funding, and IoT commercialization, concluding with an overview of Appota's six core products.
Event 1: Google Partners With Viettel to Launch Direct Carrier Billing on Google Play
On slide 19 (Global company went Local), Google partnered with Vietnam's largest mobile carrier, Viettel, to launch Vietnam's first direct carrier billing (DCB) service for Google Play app and in-app purchases ("Thanh toán trong tầm tay — Dịch vụ mua ứng dụng bằng tài khoản di động lần đầu tiên tại Việt Nam").
Slide 19 details the exact pricing and revenue-sharing structure of the Google Play–Viettel integration:
- 10% carrier surcharge paid by end users: Consumers pay an extra 10% fee to Viettel on top of the listed price for every app or in-app item purchased via their mobile SIM balance.
- Unchanged 70/30 developer revenue split: The revenue-sharing ratio between the developer (
Dev) and Google remains unchanged at 70/30. Compared with legacy scratch-card payment gateways (which typically charged 15%–20% processing fees), Viettel DCB gave Android developers a native one-tap checkout flow while preserving full 70% net developer payouts.
Event 2: MoMo Raises $28 Million as Vietnam's $4 Billion E-Commerce Market Grows 20% Annually
On slide 20 (Year of Mobile Payment?), Vietnamese mobile payment startup MoMo secured $28 million in funding from Standard Chartered Private Equity (PE) and Goldman Sachs.
The investment aligned with projections from Vietnam's Ministry of Industry and Trade, quoted on slide 20: "E-Payment (and Mobile Payment) is a key growth factor for E-commerce. Vietnam's current E-C market is estimated to be USD$4 billion and predicted to grow at 20% per anum for the next 5 years."
Appota's analysts concluded that the hardest phase of educating Vietnamese consumers on mobile payments had passed, leaving smartphone users ready to transact digitally. That readiness unlocked both a massive growth opportunity and intense competition across more than 20 payment gateways and e-wallets mapped on slide 20—including AppotaPay, MoMo, BankPlus, Viettel, 123Pay, Payoo, VNPAY Online, OnePAY, BaoKim.vn, SenPay, SohaPay, Vimo, Mobivi, VinaPay, OnOnPay, 1Pay, mPay, SoftPay.mobi, CircleBi, Betado, Trusting Social, and Cash2vn. Product teams integrating local checkout options can apply our payment gateway integration checklist to streamline multi-channel billing.
Event 3: Hachi Commercializes Vietnam's First Startup IoT Product Alongside Appota's Six-Product Ecosystem
On slide 21, the report highlights the rapid commercialization of the Internet of Things (IoT) across four leading sectors: convenient services, transportation, intelligent buildings, and retail.
In Q1 2016, Hachi—a mobile-connected smart agriculture solution enabling automated irrigation of plants and trees via smartphone—became the first IoT product commercialized by Vietnam's startup community. Throughout 2016, FPT Corporation and Bach Khoa University (Hanoi University of Science and Technology) also scheduled a series of events to raise awareness and accelerate domestic IoT product development.
Closing the presentation on slide 22, Appota outlines its mission to provide the most effective platform for mobile developers, publishers, and advertisers across mobile games, mobile payment, and advertisement through six core products:
- GAMOTA (Deliver Mobile Games): Top tier mobile game publisher (publisher of Q1 2016 hit Tiên Nghịch).
- ADSOTA (Boost Mobile App's Install & Revenue): Mobile advertising network driving app installs and monetization.
- APPOTAPAY (
A PAY): Mobile payment gateway and digital wallet infrastructure. - onClan: Social networking platform built for mobile gaming communities.
- GAME HUB.VN (GameHub.vn): Leading mobile gaming news and media portal.
- APPOTA CARD: Multi-purpose prepaid card for games and digital services.
Four Strategic Priorities for Mobile Publishers and Digital Businesses from the Q1 2016 Report
Based on Appota's Q1 2016 findings, product leaders, user acquisition managers, and studio executives operating in Vietnam can act on four concrete takeaways:
- Design 70-Second Micro-Session Loops and Optimize Builds for WVGA/HD Screens on Android 4.4–5.1: Because users pick up their phones 150–200 times daily for average sessions of 1 minute 10 seconds, and 54.83% of top Android screens run 480x800 (28.71%) or 720x1280 (26.12%) resolutions (led by Android 4.4.2 at 25% and Lollipop 5.0/5.1 at 21.40%), studios launching RPG and Card Battle titles should structure core quest loops under 90 seconds and optimize UI legibility for entry-level HD/WVGA displays.
- Allocate 80% of Mobile Media Spend to In-App Inventory With High Weighting on iOS (28% Vietnam Share): Smaato benchmarks confirm 80% of global ad spend (79% in APAC) flows into in-app placements, while iOS captures 46.69% of APAC ad budgets. In Vietnam—where iOS accounts for 28% of 34M+ smartphones—marketers should anchor budgets in in-app video and social formats targeting the 14–26 cohort (81% daily social networking, 60% mobile video, and 56% online shopping).
- Schedule Holiday Promotions for Thursday–Friday Peaks and Lead With Mobile Video Creative: Facebook's Tết study proves Vietnamese consumers create 4.2x more content on mobile than desktop (+37% videos, +23% photos) and increase mobile shopping by 86% during major holidays. E-commerce and live-ops teams should launch holiday sales on Thursday (top overall online shopping day) and trigger mobile push offers on Friday (top mobile shopping day).
- Combine Google Play–Viettel Carrier Billing With Local E-Wallets and Prepaid Cards: With end users willing to pay a 10% Viettel carrier fee for frictionless Google Play checkouts (preserving the 70/30 developer split) and Vietnam's $4 billion e-commerce market expanding at 20% annually, combining native store DCB with local gateways such as AppotaPay, Appota Card, and MoMo maximizes payer conversion across both banked and unbanked audiences.
Sources
- Vietnam Mobile Report Q1/2016 (Vietnam Mobile Report Q1 2016), Công ty Cổ phần Appota (Appota Group), 2016-04-07, accessed 2026-11-02
- Global Mobile Behavior & Vietnam Internet User / Smartphone Usage Survey (Q1 2016), GlobalWebIndex (GWI, dẫn qua báo cáo Appota), 2016-03-31, accessed 2026-11-02
- Global Mobile Advertising Spending Share by Environment and Mobile OS (Q1 2016), Smaato Publisher Platform (dẫn qua báo cáo Appota), 2016-03-31, accessed 2026-11-02
- Case Study: Tết and Mobile — Vietnam Lunar New Year Mobile Content & Shopping Insights (Feb 2016), Facebook IQ / Facebook (dẫn qua báo cáo Appota), 2016-02-29, accessed 2026-11-02
- Dự báo quy mô thương mại điện tử Việt Nam và các sự kiện thanh toán di động, IoT quý 1/2016, Bộ Công Thương Việt Nam (Ministry of Industry and Trade), Google Play, Viettel, MoMo, FPT & ĐH Bách khoa, 2016-03-31, accessed 2026-11-02
- Hệ thống đo lường thiết bị, kho ứng dụng và phát hành game di động tại Việt Nam quý 1/2016 (Appota Platform), Công ty Cổ phần Appota (Appota Group), 2016-04-07, accessed 2026-11-02