
Vietnam Mobile Market and App Advertising Report Q1 2017
The Vietnam mobile market report for Q1 2017 by Appota and Adsota records 49 million internet users, 44 million 3G subscriptions (Viettel holding 48%), and 72% urban smartphone penetration. Users spend 114 minutes daily on smartphones, Zalo tops messaging at 80%, mobile games overtake PC with 20.4% of Southeast Asia's $783.10 million revenue, and average AdMob interstitial eCPM reaches $0.27.
Appota and Adsota Q1 2017 Vietnam mobile market report: 44M 3G users, 72% urban smartphones, 80% Zalo reach, mobile games passing PC, and eCPM data.
Key findings
- 44M 3G & 49M internet usersVietnam reached 49 million active internet users (16th worldwide), 131.9 million mobile subscribers, and 44 million 3G subscriptions in 2016 (up from 22 million in 2014 and 30 million in 2015; VNTA logged 43,919,045 3G and 76,681,190 2G subscriptions). Viettel held 48% of 3G subscriptions, MobiFone 26%, and VinaPhone 18% (Appota, Zing.vn, VNTA).
- 72% urban & 88% MillennialsUrban smartphone penetration in Vietnam rose from 20% (2013) to 36% (2014), 55% (2015), and 72% in 2016, while rural penetration reached 53% (Consumer Barometer, TNS, Google, n = 1,000). Comscore data shows total mobile reach jumping from 69% among all users to 88% among Millennials aged 18–34 (+19 percentage points).
- 68% Android / 84% iOS 10Android accounted for 68% of Vietnamese smartphones, iOS 25%, and other operating systems 7% (Appota, Asian Business Insight). Apteligent tracking through December 2016 showed 84% of iOS devices upgraded to iOS 10 within 3 months, whereas Android 7.0/7.1 Nougat remained below 1% after 4 months and 42.94% of Android phones used WVGA/qHD screens.
- 114 mins/day & 94% socialVietnamese users spent an average of 114 minutes per day online on smartphones (63 minutes on mobile web browsers and 51 minutes inside mobile apps), surpassing 100 minutes on computers (TNS, Google, n = 1,000). Users installed 5 new apps per month on average (Games topped installs at 69%), while 94% used social networking and 91% used messaging daily.
- 80% Zalo & 73% MessengerAn Appota survey of 1,200 smartphone respondents found Zalo topping OTT messaging apps in Vietnam at 80% reach, followed by Facebook Messenger (73%), Viber (40%), Skype (37%), and Line (18%). The top five OTT activities were text messaging (80%), sending photos (58%), phone calls (56%), video calls (40%), and voice messaging (23%).
- 85% COD & 36% Lazada shareVietnam's e-commerce market approached $0.95 billion in 2016, with more than 31% of online shopping generated via mobile apps and Lazada holding 36% market share (Euromonitor, VNG). Q&Me surveys show 40% of shoppers used smartphone apps, yet 85% of all buyers paid via cash on delivery (COD), compared to 8% bank transfer and 6% card.
- 20.4% of SEA game revenueIn 2016, mobile game revenue in Vietnam surpassed PC games for the first time within an estimated ~$320 million game market, contributing 20.4% of the Big 6 Southeast Asian game revenue pool ($783.10 million) — second after Singapore (22.7%). Pokémon GO hit 8.8 million downloads, while VNG, Gamota, Garena, and VTC dominated monetization.
- 75% ad share & $0.27 eCPMIn Adsota's Q1 2017 deck, Google and Facebook captured 75% of Vietnam digital ad spending. Average AdMob interstitial eCPM in Vietnam stood at $0.27 in January 2017 (versus $6.47 in the US), programmatic ad spending was projected to surge from $4 million (2015) to $33 million (2019), and Adsota launched the AppotaX ad exchange.
The Vietnam mobile market report for Q1 2017 (Appota Q1 2017 report) by Appota and Adsota documents a critical growth inflection as Vietnam reached 49 million internet users, 44 million 3G subscriptions, and 72% urban smartphone penetration. This analysis integrates Appota's 27-page PDF report Entering Vietnam Mobile Market 2017 (linkDownload) with Adsota's 23-slide presentation Vietnam Mobile App Advertising & Monetization Report Q1 2017 (linkView) published in April 2017.
Five structural shifts define the Q1 2017 landscape: major telecom operators launched commercial 4G LTE services, users spent 114 minutes per day online via smartphones, Zalo (80%) and Facebook Messenger (73%) dominated OTT communication, Vietnam mobile games surpassed PC game revenue for the first time to capture 20.4% of Southeast Asia's gaming market, and mobile app advertising entered its programmatic phase with AppotaX.
Which 10 events shaped the Vietnam mobile market entering Q1 2017?
On page 3 of the PDF report Entering Vietnam Mobile Market 2017, Appota reviews 10 milestone events from 2016 that established the baseline for Q1 2017 market operations:
- Bigo Live sparked a live-streaming wave: Real-time video broadcasting gained rapid traction among young Vietnamese users.
- Samsung permanently ended Galaxy Note 7 production: Global battery recalls forced Vietnam's largest Android vendor to discontinue its flagship phablet.
- Pokémon GO approached 9 million downloads in Vietnam: The augmented-reality hit generated 8.8 million downloads nationwide (page 25).
- Sam Media was fined for billing violations: Regulators penalized opaque SMS subscription charges, tightening carrier-billing compliance.
- Vietnam awarded 4G licenses to the three biggest telcos: Viettel, MobiFone, and VinaPhone received approval for commercial 4G rollouts in 2017.
- Monkey Junior won international education awards: A Vietnamese EdTech application earned global recognition in early childhood learning.
- Mobile payment firm MoMo raised $28 million: Standard Chartered Bank co-led the investment round, accelerating domestic e-wallet adoption.
- Mobile game revenue passed PC for the first time: Smartphones overtook desktop PCs as the top revenue driver for game publishers.
- Lazada Vietnam posted a GMV milestone of $7.8 million per day: Peak campaign sales set a new record for domestic e-commerce.
- Vietnam ranked among the Top 20 internet countries worldwide: Reaching 49.0 million users, Vietnam placed 16th globally.
How fast did 3G subscriptions, smartphone penetration, and OS adoption grow in Vietnam?
The first analytical chapter of the PDF report (pages 4–11) combines datasets from Appota, Zing.vn, Consumer Barometer (TNS / Google), Comscore, Asian Business Insight, and Apteligent with Vietnam Telecommunications Authority (VNTA) figures in Adsota's Vietnam Mobile App Advertising & Monetization Report Q1 2017 on SlideShare (slides 4–6).
49 million internet users, 44 million 3G subscriptions, and carrier market share
On pages 4 and 5 of the PDF report, Appota records Vietnam's population at over 93 million (48% male, 52% female), with 49 million active internet users, 131.9 million active mobile subscribers, and 38 million active mobile social users.
Among the top 20 countries by internet users in 2016 (page 5), Vietnam ranked 16th at 49.0 million, following China (721.4M), India (462.1M), the US (286.9M), Brazil (139.1M), Indonesia (132.7M), Japan (115.1M), Russia (103.1M), Nigeria (97.2M), Germany (71.7M), Mexico (69.0M), Bangladesh (63.2M), the UK (60.2M), Iran (56.7M), France (55.8M), and the Philippines (54.0M), while ranking ahead of Turkey (46.0M), South Korea (45.3M), Thailand (41.0M), and Italy (39.2M). In Southeast Asia (Adsota slide 4), Malaysia recorded 21.5M users.
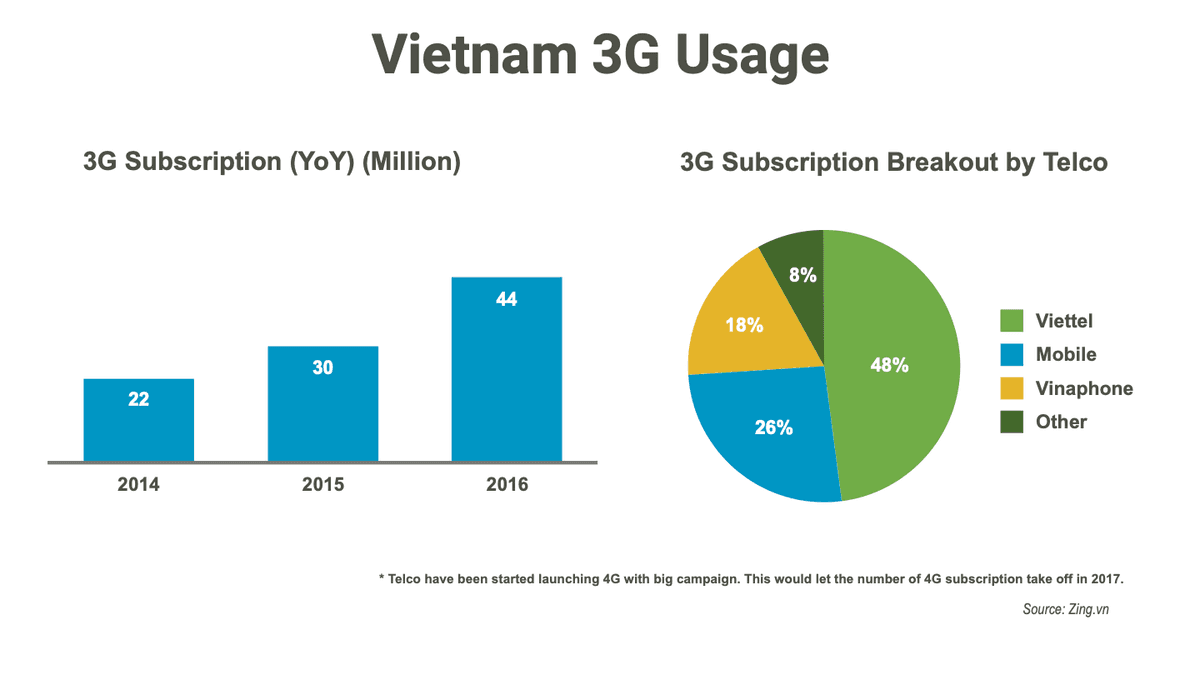
According to Zing.vn (PDF page 6), Vietnam's 3G subscriptions doubled from 22 million (2014) to 30 million (2015) and 44 million in 2016. Adsota's presentation (slide 4) cites VNTA registry counts of 43,919,045 3G subscriptions and 76,681,190 2G subscriptions. By carrier share (page 6), Viettel held 48%, MobiFone held 26% (misprinted as "Mobile" on the chart), VinaPhone held 18%, and other carriers accounted for 8%.
72% urban smartphone penetration and 88% mobile reach among Millennials
Consumer Barometer research (TNS / Google, n = 1,000, PDF page 7) shows urban smartphone penetration in Vietnam climbing from 20% (2013) to 36% (2014), 55% (2015), and 72% in 2016, while rural penetration reached 53%.
On page 8 of the PDF report, Comscore compares platform usage (Desktop only, Multi-Platform, Mobile only) between All Users and Millennials (18–34):
| Market (Comscore, PDF page 8) | Mobile Reach — All Users | Mobile Reach — Millennials (18–34) | Uplift | Millennial Split (Desktop / Multi / Mobile only) |
|---|---|---|---|---|
| Vietnam | 69% (~30% desktop, ~33% multi, ~36% mobile) | 88% | +19 pts | ~12% desktop / ~38% multi / ~50% mobile only |
| Malaysia | 68% (~32% desktop, ~30% multi, ~38% mobile) | 87% | +19 pts | ~13% desktop / ~36% multi / ~51% mobile only |
| Singapore | 85% (~15% desktop, ~55% multi, ~30% mobile) | 91% | +6 pts (prints +7 pts) | ~9% desktop / ~60% multi / ~31% mobile only |
| UK | 71% (~29% desktop, ~47% multi, ~24% mobile) | 89% | +18 pts | ~11% desktop / ~55% multi / ~34% mobile only |
| USA | 76% (~24% desktop, ~51% multi, ~25% mobile) | 94% | +18 pts | ~6% desktop / ~59% multi / ~35% mobile only |
In Vietnam, half of Millennials (~50%) accessed the internet exclusively via mobile devices. Meanwhile, StatCounter, Statista, and eMarketer data (Adsota slide 6) shows mobile devices accounted for 34% of total web traffic in Vietnam in 2016, behind Indonesia (69%), Thailand (66%), Singapore (53%), and Malaysia (44%).
68% Android share, 84% iOS 10 adoption in 3 months, and sub-1% Android Nougat
On page 9 of the PDF report, Appota and Asian Business Insight report Vietnam's smartphone OS split at 68% Android, 25% iOS, and 7% Other, placing Vietnam third in Southeast Asia for iOS share:
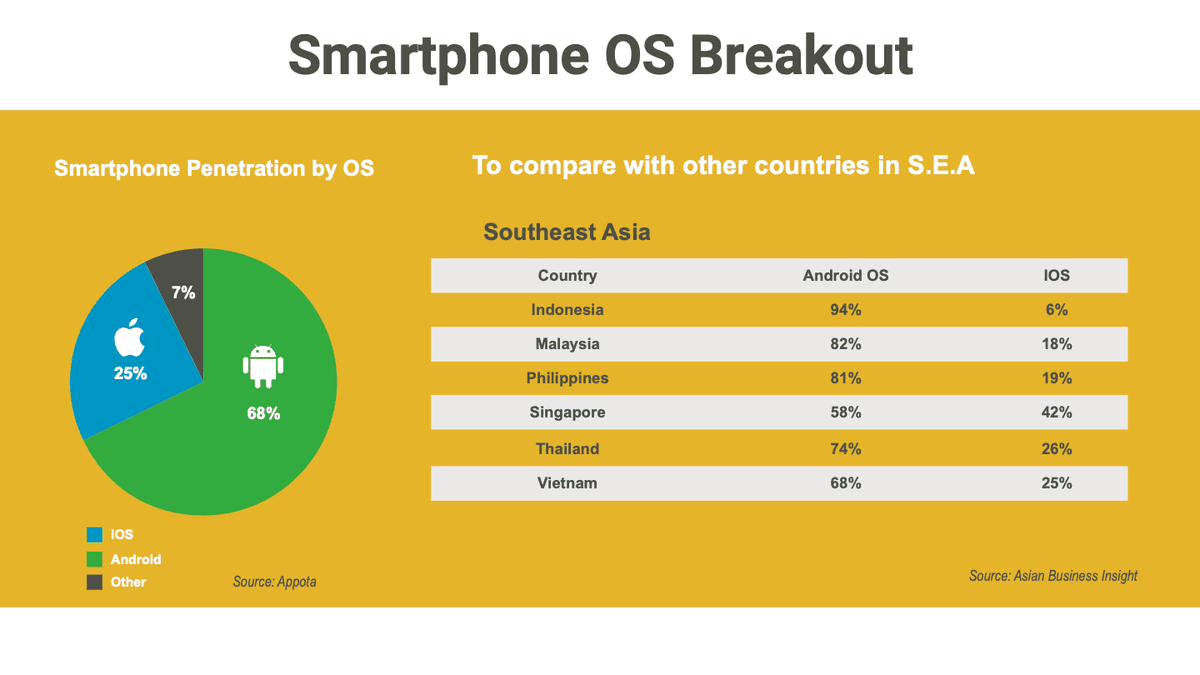
- Southeast Asia Android / iOS share (page 9): Indonesia (94% / 6%), Malaysia (82% / 18%), Philippines (81% / 19%), Thailand (74% / 26%), Vietnam (68% / 25%, omitting 7% Other in the two-column table), and Singapore (58% / 42%).
- OS version adoption (Apteligent, Jan 1 – Dec 1, 2016, page 10): Released on September 13, 2016, iOS 10 reached ~84% of iOS devices by December 2016 (iOS 9 dropped from ~91% peak to ~15%, iOS 8 ~3%, iOS 7 ~1%). Conversely, Android Nougat (7.0/7.1) stayed below 1% four months after its late-August 2016 release (Marshmallow 6.0 rose to ~58%, Lollipop 5.0–5.1 fell to ~36%, KitKat 4.4 held ~23%, Jelly Bean ~10%).
- Vietnam Android screen resolutions (page 11): WVGA 480×800 (28.71%), HD 720×1280 (26.12%), HD 720×1184 (15.78%), Full HD 1920×1080 (15.16%), and qHD 540×960 (14.23%) — meaning 84.84% of Android phones ran HD or lower displays.
How did Vietnamese users engage with mobile apps and OTT messaging platforms?
The second chapter of the PDF report (pages 12–19) evaluates daily online time, category frequency, hourly ad impressions, and OTT messaging behavior.
114 daily minutes on smartphones and usage frequency across 15 app categories
According to TNS / Google (n = 1,000, PDF pages 15–16), Vietnamese users spent 114 minutes per day online on smartphones (63 minutes on mobile web browsers and 51 minutes inside mobile apps), ahead of 100 minutes per day on computers. Users installed an average of 5 new apps per month (misprinted as "+5% app installed each month" on page 16).
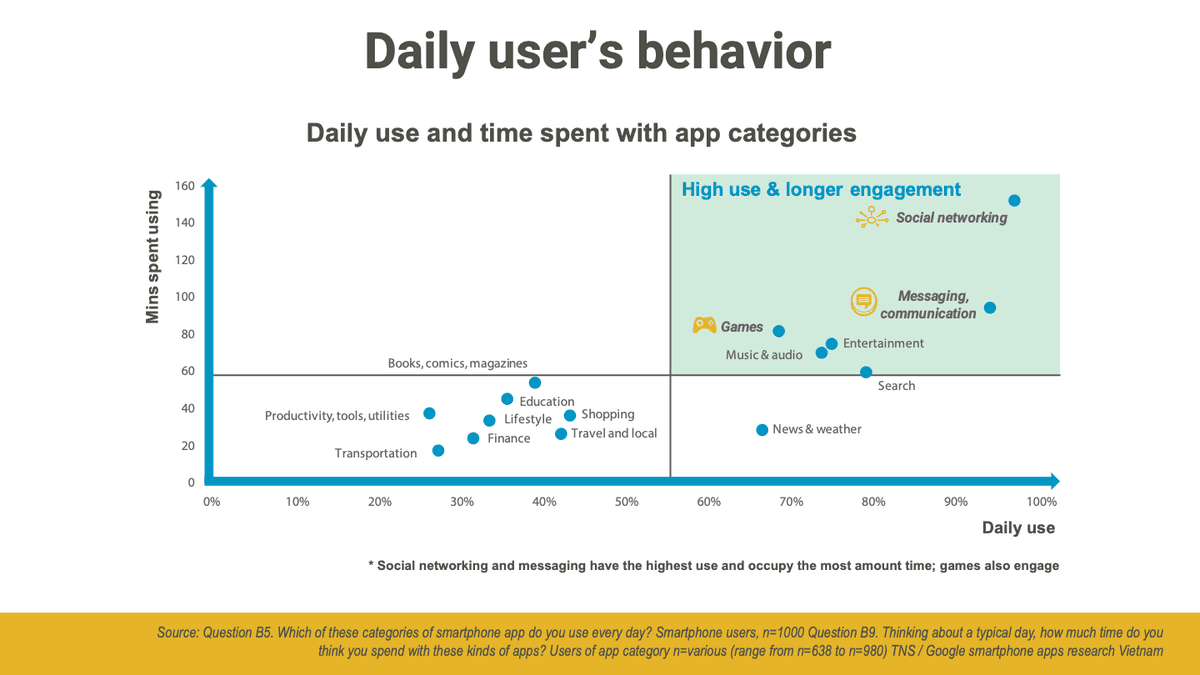
Monthly install rates (page 16), usage frequency (page 17), and daily minutes spent (page 13, n = 638–980) across core categories include:
| App Category (TNS / Google, PDF pages 13, 16, 17) | Monthly New Install (%) | Use Daily (%) | Use Regularly (%) | Avg Daily Time (page 13) |
|---|---|---|---|---|
| Social networking | 68% | 94% | 4% (98% total) | ~150 mins |
| Messaging, communications | 66% | 91% | 4% (95% total) | ~95 mins |
| Search | 62% | 87% | 10% (97% total) | ~58–60 mins |
| Media & Entertainment | 63% | 73% | 14% (87% total) | ~75 mins |
| Music & Audio | 62% | 72% | 13% (85% total) | ~70 mins |
| Games | 69% (Top category) | 67% | 10% (77% total) | ~80 mins |
| News & weather | 58% | 65% | 14% (79% total) | ~28 mins |
| Shopping & e-commerce | 55% | 43% | 21% (64% total) | ~35 mins |
| Travel and local | Outside Top 10 | 42% | 21% (63% total) | ~26 mins |
| Books, comics, magazines | 59% | 39% | 17% (56% total) | ~54 mins |
| Education | 57% | ~35%–36% | Not split on p.17 | ~45 mins |
Four additional categories on page 13 include Lifestyle (~33% daily use, ~33 mins), Finance (~31%, ~24 mins), Transportation (~27%, ~18 mins), and Productivity, tools, utilities (~26%, ~38 mins). Across the 24-hour impression curve (page 14), Phone traffic rises first in Early Morning (7am–10am), Desktop peaks during Daytime (10am–5pm, printed as 10am - 5am), and Phone and Tablet peak during Prime Time (8pm–12am).
Zalo topped OTT messaging at 80%, Messenger reached 73%, and B2C chatbots emerged
An Appota survey of 1,200 smartphone users (PDF page 18, selecting up to 3 apps) shows Zalo in first place at 80%, followed by Facebook Messenger (73%), Viber (40%), Skype (37%), Line (18%), Yahoo (11%), Tango (9%), WeChat (5%), WhatsApp (4%), Kakao Talk (3%), and Other (6%).
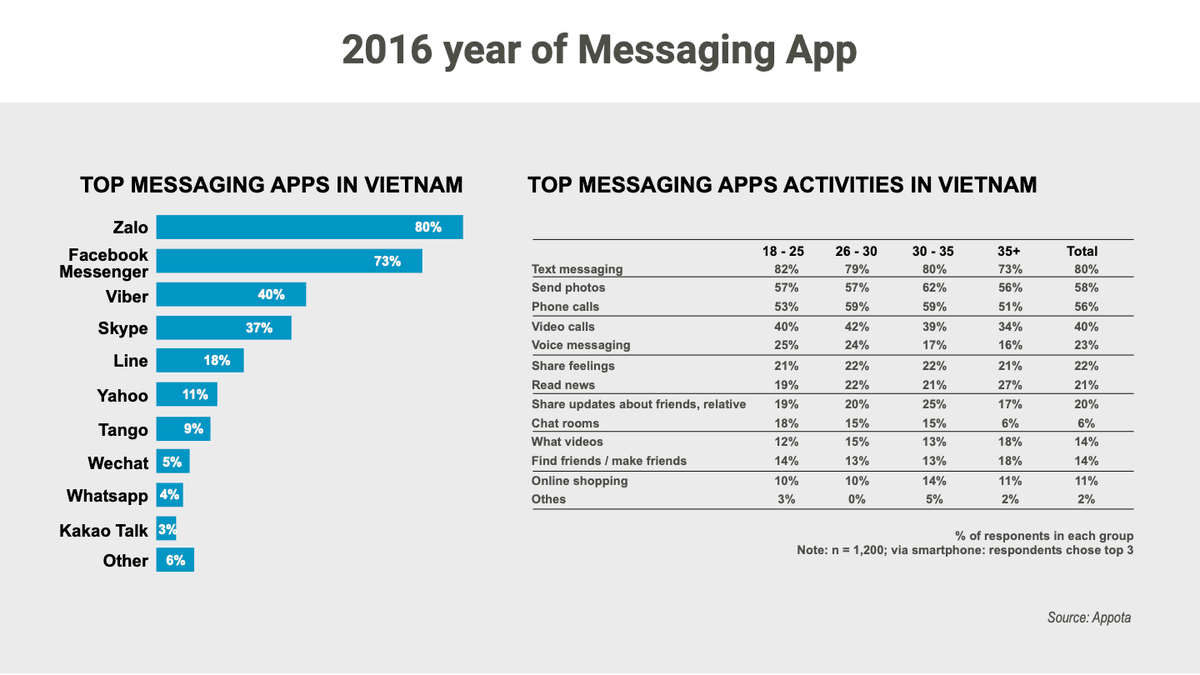
User activities on OTT apps by age bracket (page 18) break down as follows:
| OTT Activity (Appota, n = 1,200) | Ages 18–25 | Ages 26–30 | Ages 30–35 | Ages 35+ | Total |
|---|---|---|---|---|---|
| Text messaging | 82% | 79% | 80% | 73% | 80% |
| Send photos | 57% | 57% | 62% | 56% | 58% |
| Phone calls | 53% | 59% | 59% | 51% | 56% |
| Video calls | 40% | 42% | 39% | 34% | 40% |
| Voice messaging | 25% | 24% | 17% | 16% | 23% |
| Share feelings | 21% | 22% | 22% | 21% | 22% |
| Read news | 19% | 22% | 21% | 27% | 21% |
| Share updates about friends, relatives | 19% | 20% | 25% | 17% | 20% |
| Watch videos (printed as "What videos") | 12% | 15% | 13% | 18% | 14% |
| Find friends / make friends | 14% | 13% | 13% | 18% | 14% |
| Online shopping | 10% | 10% | 14% | 11% | 11% |
| Chat rooms | 18% | 15% | 15% | 6% | 6% |
| Others (printed as "Othes") | 3% | 0% | 5% | 2% | 2% |
On page 19, the report highlights how Messenger, Zalo, and Line APIs integrated with B2C customer communication software, blending human agents with AI and Chatbots for automated billing, shopping, and support.
How did mobile commerce expand while 85% of Vietnamese buyers relied on COD?
On page 20 of the PDF report, Euromonitor and VNG data tracks Vietnam's e-commerce market rising from ~$0.45 billion (2013) to ~$0.60 billion (2014), ~$0.80 billion (2015), and nearly $0.95 billion in 2016 (the chart axis mislabels 0.0–1.0 billion USD as USD (Million)), with mobile commerce reaching roughly $0.45 billion. Over 31% of online shopping originated from apps, food was ordered more often via mobile than laptop, Lazada held 36% market share, 49% spent $10–$20 per order, and over 30% shopped 2–3 times monthly.
| E-Commerce Metric (Q&Me, PDF pages 21–22) | Segment / Split | Share | Behavioral & Operational Note |
|---|---|---|---|
| Device: Home PC | Usage / Penetration | 52% / 31% | Largest traditional browsing screen |
| Device: Smartphone browser | Usage / Penetration | 47% / 25% | Second overall via social ad traffic |
| Device: Smartphone app | Usage / Penetration | 40% / 23% | Lazada (10M–50M downloads) offered a 50,000 VND install voucher |
| Device: Office PC | Usage / Penetration | 29% / 17% | Daytime workplace ordering |
| Device: Tablet (Browser / App) | Usage / Penetration | 9% (2%) / 6% (1%) | Small share matching tablet penetration |
| Payment: All users | COD / Bank transfer / Card | 85% / 8% / 6% | High COD reliance drives order cancellations |
| Payment: Heavy users | COD / Bank transfer / Card | 76% / 14% / 10% | 24% of orders paid via bank transfer or card |
| Payment: Light users | COD / Bank transfer / Card | 90% / 5% / 4% | 9 in 10 orders rely on cash on delivery |
Alongside Lazada (B2C), page 21 profiles Chợ Tốt (C2C, 1M–5M downloads), iCheck (barcode scanner, 1M–5M downloads), and Quà tặng Galaxy (1M–5M downloads). To reduce COD cancellation rates, merchants can streamline prepaid checkout using our payment gateway integration checklist.
Why did Vietnam mobile games overtake PC and rank second in Southeast Asia?
On page 23 of the PDF report, Vietnam's total game revenue climbed from ~$260 million (2013) to ~$275 million (2014), ~$290 million (2015), and ~$320 million in 2016. In 2016, Vietnam mobile games (~$160 million) surpassed PC game revenue for the first time.
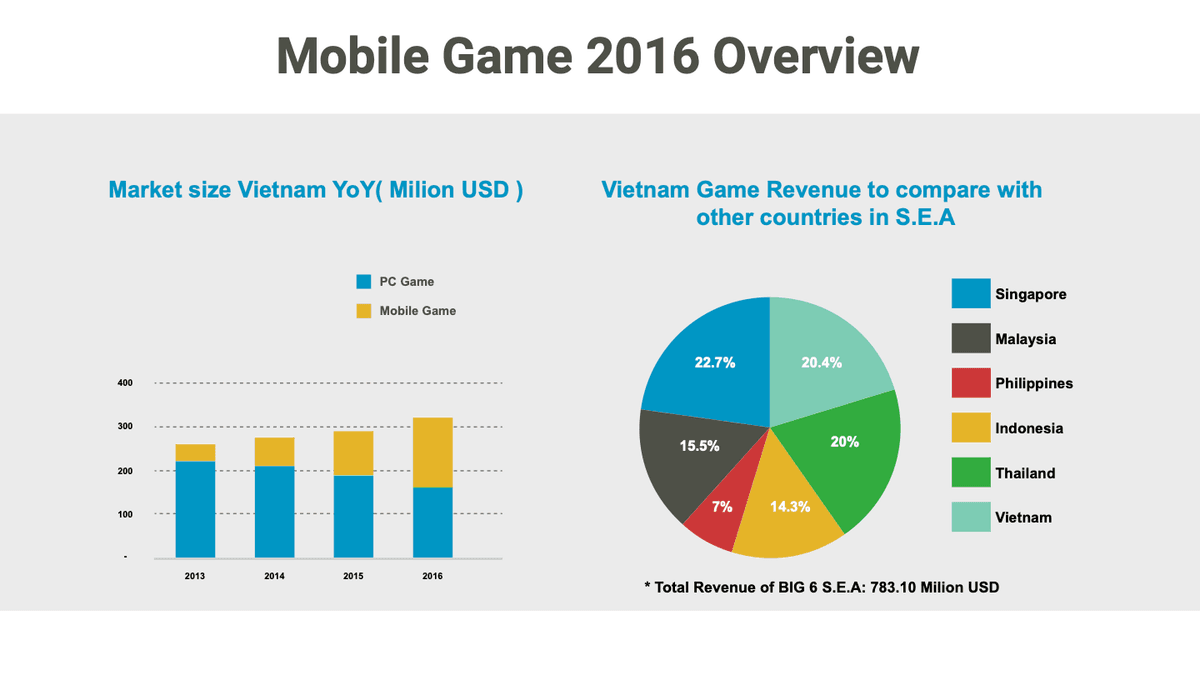
Across the $783.10 million Big 6 Southeast Asian game market (page 23): Singapore ranked first at 22.7%, Vietnam placed second at 20.4% (~$159.8 million), ahead of Thailand (20%), Malaysia (15.5%), Indonesia (14.3%), and the Philippines (7%).
Pages 24–25 list Vietnam's five most successful mobile games of 2016 — Ỷ Thiên 3D (Gamota), Võ Lâm Truyền Kỳ Mobile (VNG), Liên Quân Mobile (Garena), Ngôi Sao Thời Trang 360mobi (VNG), and Tập Kích (VTC Mobile) — published by Gamota, VNG, VTC Game, VTC Mobile, and Garena. Meanwhile, top global downloads Pokémon GO (8.8M downloads), Talking Tom (8.1M), and Slither.io (7.0M) struggled with direct monetization due to local payment friction. Foreign studios can review licensing and payment localization in our guide to mobile game publishing in Vietnam.
What eCPM benchmarks did Vietnam mobile app advertising record in Q1 2017?
Adsota's 23-slide presentation Vietnam Mobile App Advertising & Monetization Report Q1 2017 (linkView) details app store supply, ad spend concentration, and Vietnam eCPM benchmark performance.
Google and Facebook captured 75% of digital ad spend as app stores hit 5 million apps
According to Statista and AppBrain in March 2017 (slides 7–8), Google Play hosted 2,800,000 apps (18% Games) and Apple App Store hosted 2,200,000 apps (25% Games), followed by Windows Store (669,000), Amazon Appstore (600,000), and BlackBerry World (234,500). In Vietnam (slide 11, Kantar Media, Google, VNG, Statista), Google and Facebook captured 75% of digital ad spending, leaving 25% for all other networks.
$0.27 AdMob interstitial eCPM and 4-network performance from Dec 2016 to Apr 2017
Adtapsy and Adsota data for January 2017 (slide 12) shows global AdMob interstitial eCPMs clustering in $1.00–$1.99 (26.3% of countries), $0.01–$0.99 (21.1%), $2.00–$2.99 (19.2%), and $3.00–$3.99 (7.6%). Compared against $6.47 in the US, $6.16 in Australia, $4.28 in Norway, $3.29 in Canada, and $2.02 in New Zealand, Vietnam's average AdMob interstitial eCPM was $0.27 (with seasonal peaks between April 2015 and January 2017 reaching $1.39–$2.01).
Appodeal telemetry from December 2016 to April 2017 (slides 13–14) tracks four major networks in Vietnam:
| Ad Network & Model (Appodeal, Dec 2016 – Apr 2017) | Android eCPM in Vietnam | iOS eCPM in Vietnam | Q1 2017 Performance Notes (Slides 13–14) |
|---|---|---|---|
| AdMob (CPC) | ~$0.30 – $0.45 | ~$0.55 – $0.95 | Stable fill rates across banner and interstitial placements |
| Facebook Audience Network (CPM) | ~$0.55 – $0.90 | ~$0.90 – $1.50 | Strong CPMs driven by social identity targeting |
| Unity Ads (CPI — Video) | Peak ~$1.05 (Dec 2016); ~$0.55–$0.75 Q1 | ~$1.00 – $1.45 | Primary video monetization channel for game studios |
| AdColony (CPM — Video) | ~$0.65 – $0.95 | Top yield at ~$1.60 – $2.80 | High-definition video on iOS delivers 2–3× Android eCPM |
Slide 15 advises placing ads at natural breaks, capping frequency, avoiding accidental clicks near controls, and prioritizing rewarded video. Subsequent quarterly benchmarks are detailed in our Q2 2017 Vietnam mobile app advertising report.
Six 2017 ad trends, 8.25x programmatic growth in Vietnam, and the launch of AppotaX
Across slides 17–22, Adsota highlights six 2017 trends: (1) Fight against Mobile Ad Fraud, (2) AR/VR Advertising, (3) Chatbots, (4) Mobile Ad Blocking, (5) Fall of Incentive Installs, and (6) Mobile Programmatic Advertising. According to Statista and eMarketer (slide 19), programmatic ad spending in Vietnam was projected to grow 8.25× from $4 million (2015) to $33 million (2019) — outpacing relative growth in Indonesia ($40M to $244M), Thailand ($13M to $51M), Singapore ($13M to $40M), and Malaysia ($34M to $77M).
In Q1 2017 news (slides 20–22), alongside YouTube requiring 10,000 lifetime views for channel monetization, Adsota launched AppotaX — Google's Mobile In-App DFP for Small Business and Ad Exchange platform operated exclusively in Vietnam.
How was the Vietnam mobile ecosystem structured across 9 pillars in Q1 2017?
On pages 26–27 of the PDF report, Appota maps the Vietnam Mobile Ecosystem across nine groups:
- Publishers: Gamota, VNG, VTC Game, VTC Mobile, Garena, SohaGame, ME Corp, Vega Game, TeaMobi, Asiasoft, VTC Online, NetEase Games, Gamevil, and Mobvista.
- Advertising & Marketing: Adsota, Admicro, Adtima, CleverAds, Ambient Digital, Admatic, AdFlex, Ecomobi, and Adways.
- Social, Live Streaming & Payments: Facebook, Zalo, YouTube, Instagram, Skype, Line; Bigo Live, Facebook Live, TalkTV; and 14 payment platforms (AppotaPay, MoMo, ZaloPay, Payoo, VTC Pay, OnePAY, 1Pay, BaoKim.vn, NgânLượng.vn, SohaPay, Smartlink, OnOnPay, Moca, Paymentwall).
- Media, Infrastructure, Carriers & Events: GenK, ICTnews, VnExpress, CafeF, GameK.vn, GameHub.vn; VCCloud, KDATA, Mắt Bão, Nhân Hòa, vHost; Viettel, MobiFone, VinaPhone, Vietnamobile; and Vietnam Mobile Day, Bluebird Award, and Echelon Vietnam.
By Q1 2017 (page 27), Appota reached over 30 million users and 15,000+ global developers, advertisers, and merchants across game publishing (Gamota), advertising (Adsota / AppotaX), and payments (AppotaPay). For teams in the gaming and mobile application sector, the Q1 2017 Vietnam mobile market dataset provides an empirical baseline to pair Android scale (68%) with iOS monetization (25% share, 84% on iOS 10, 2–3× video eCPM) and local OTT reach as 4G LTE expands nationwide.
Sources
- Entering Vietnam Mobile Market 2017 — Báo cáo thị trường di động Việt Nam quý 1/2017 (PDF 27 trang), Công ty Cổ phần Appota (Appota Inc.), 2017-04-01, accessed 2026-11-02
- Vietnam Mobile App Advertising & Monetization Report Q1 2017 — Báo cáo quảng cáo và kiếm tiền trên ứng dụng di động Việt Nam quý 1/2017 (SlideShare 23 trang), Công ty Cổ phần Adsota (Adsota — thuộc Appota Group), 2017-04-22, accessed 2026-11-02
- Vietnam Internet Demographic, 3G Subscriptions (2014–2016) & Telco Market Share, Appota, Zing.vn & Cục Viễn thông (VNTA), 2017-03-31, accessed 2026-11-02
- Consumer Barometer — Google Smartphone Apps Research Vietnam (TNS, n = 1,000), Google & TNS (Consumer Barometer), 2016-12-31, accessed 2026-11-02
- Multi-Platform & Mobile Reach Among All Users vs. Millennials (Comscore) & SEA Mobile Web Traffic (StatCounter, Statista, eMarketer), Comscore, StatCounter, Statista & eMarketer, 2016-12-31, accessed 2026-11-02
- Southeast Asia Smartphone OS Breakout & Mobile OS / Screen Fragmentation Trends 2016, Appota, Asian Business Insight & Apteligent, 2016-12-15, accessed 2026-11-02
- Vietnam Messaging App Market Share & Activities by Age Group (2016, n = 1,200), Appota Research, 2017-01-15, accessed 2026-11-02
- Vietnam Mobile Commerce Overview, Shopping Devices & Payment Methods (2016), Euromonitor, VNG & Q&Me Vietnam Market Research, 2016-12-31, accessed 2026-11-02
- Vietnam & Big 6 SEA Game Market Revenue and Top Mobile Games 2016, Appota & Gamota, 2017-03-31, accessed 2026-11-02
- App Store Catalog, Digital Ad Spend Share, AdMob/Appodeal eCPM Benchmarks & SEA Programmatic Ad Spending (2015–2019), Statista, AppBrain, Kantar Media, Adtapsy, Appodeal, eMarketer & Adsota, 2017-04-20, accessed 2026-11-02