Vietnam Mobile App Advertising and Monetization Report Q2 2017
Adsota's Q2 2017 Vietnam mobile app advertising and monetization report analyzes install acquisition costs and publisher revenue streams across Android (67% mobile share) and iOS (29.4%). Vietnam recorded average game CPIs of USD 0.61 on Android and USD 0.71 on iOS (Chartboost), while in-app advertising drove 56% of global mobile publisher revenue alongside 39% from IAP (AdColony).
An executive breakdown of Vietnam's Q2 2017 mobile OS and app store landscape, USD 0.61–0.71 game CPI benchmarks, H1 2017 eCPM curves, and LTV indicators from Adsota.
Key findings
- 67% Android & 73.1% iOSAndroid captured 67% of mobile phone OS traffic in Vietnam (vs. 29.4% for iOS and 4.0% others), whereas iOS dominated tablets at 73.1% share (vs. 26.7% for Android) according to Appota and StatCounter.
- 70.8% H1 phone salesSamsung (47.6%) and Oppo (23.2%) accounted for 70.8% of new mobile phone purchases in Vietnam in H1 2017—far ahead of Apple's 8.9% retail unit share despite iOS driving 29.4% of active mobile traffic (GfK, StatCounter, May 2017).
- 35M Facebook users (7th)Active Facebook user base in Vietnam (70% of the online community, ranking 7th globally); Facebook and YouTube tied at 51% social network share, while Messenger (37%) and Zalo (30%) led messaging apps (Statista, We Are Social, 2017).
- 85.7% & 49.8% GrossingGames' share of top-grossing apps in Vietnam on Google Play (85.7%) and Apple App Store (49.8%), while non-game grossing titles gained stronger traction on iOS led by Photography (8.1%), Education (7.3%), and Productivity (5.0%) per Applyzer (July 2017).
- USD 0.61 & USD 0.71 CPIVietnam's average mobile game Cost Per Install (CPI) in July 2017 on Android (USD 0.61—second highest in Southeast Asia behind Singapore's USD 1.38) and iOS (USD 0.71), roughly 4–5x lower than Tier-1 markets like the US and Japan (Adsota, Chartboost).
- 56% ad revenue shareShare of global mobile publisher revenue generated by in-app advertising (31% video, 20% display, 5% native), surpassing direct in-app purchases at 39%; among non-gaming apps, advertising contributed 76% of total revenue (AdColony, Summer 2017).
- 75% effective, 87% top UXPercentage of surveyed mobile publishers rating rewarded video as the most effective monetization method (75%, ahead of IAP at 63%) and best user experience format (87%); in Vietnam, iOS rewarded video eCPM peaked near USD 2.90 in H1 2017 (AdColony, Appodeal).
How did OS, browser, and social shares shape Vietnam mobile app advertising in Q2 2017?
The Vietnam mobile app advertising market entered Q2 2017 with an operating system split closely mirroring global patterns. According to Appota and StatCounter data cited in Adsota's report, combined global mobile and tablet traffic stood at 70.2% Android, 22.6% iOS, and 7.2% other platforms. Separated by form factor worldwide, Android captured nearly 73% of mobile phone OS share, whereas Apple's iOS led tablets with 65%.
Vietnam exhibited an even sharper divide between phones and tablets according to Appota and StatCounter. On mobile phones, Android accounted for 67% of active traffic, followed by iOS at 29.4% and other OSs at 4.0%. On tablets, iPad adoption pushed iOS to a dominant 73.1% share, leaving Android at 26.7% and other systems at 0.2%.
Software update velocity also diverged sharply across the two ecosystems, creating distinct SDK testing requirements for engineering teams. Globally in Q2 2017, 86% of Apple devices already ran iOS 10 (with 11% on iOS 9 and roughly 3% on earlier releases). By contrast, Android remained heavily fragmented across older generations led by Marshmallow 6.0 (31.8%), Lollipop 5.0–5.1 (30.1%), and KitKat 4.4 (17.1%), while Nougat 7.0–7.1.1 reached only 11.5%.
Why Apple's 8.9% retail sales share understated Vietnam's 29.4% active iOS audience
A frequent mistake among overseas marketers entering Vietnam is sizing iOS budgets solely from new retail handset shipments. According to H1 2017 retail purchase tracking from GfK (misprinted as JFK on slide 5) and StatCounter as of May 2017, Samsung led new phone purchases in Vietnam at 47.6%, followed by Oppo at 23.2%. Together, those two Android brands captured 70.8% of H1 2017 unit sales—far ahead of Apple (8.9%), Mobiistar (3.0%), Sony (2.8%), Huawei (2.7%), Vivo (2.1%), and Asus (1.7%).
Despite representing just 8.9% of official new handset purchases, iOS generated 29.4% of active mobile phone traffic and 73.1% of tablet traffic nationwide. Multi-year iPhone hardware lifecycles alongside gray-market and pre-owned imports sustained an active iOS installed base more than triple Apple's quarterly retail share. Under-allocating to iOS meant missing Vietnam's highest-converting in-app spenders and highest-eCPM ad inventory.
Google's 97.1% mobile search share and Facebook's 35 million Vietnamese users
Browser and search engine benchmarks from StatCounter in May 2017 highlight how domestic desktop challengers gave way to global platforms on mobile screens:
| Platform Layer (StatCounter, May 2017) | Mobile & Tablet Leaders in Vietnam | Desktop Leaders in Vietnam | Media Planning Implication |
|---|---|---|---|
| Web Browsers | Chrome (42.4%), Safari (35.5%), UC Browser (5.8%), Samsung Internet (3.7%), Android Browser (2.8%) | Chrome (54.6%), Coc Coc (30.8%), Firefox (6.6%), IE/Edge (3.1%), Safari (2.0%) | Mobile landing pages must render cleanly on both Chrome and Safari (77.9% combined) |
| Search Engines | Google (97.1%), Yahoo! (1.27%), Baidu (0.5%), Bing (0.5%), Coc Coc (0.4%) | Google (89.1%), Coc Coc (6.4%), Yahoo! (2.3%), Bing (1.8%), Baidu (0.1%) | Mobile search acquisition concentrates almost entirely on Google Search |
On social and messaging channels, 2017 figures from Statista and We Are Social recorded roughly 35 million Facebook users in Vietnam—equivalent to 70% of the country's online community and ranking 7th worldwide. Across social network penetration, Facebook and YouTube tied for first place at 51% each, ahead of Google+ (32%), Instagram (22%), Twitter (22%), and LinkedIn (14%).
Within messenger, chat, and VoIP apps, Facebook Messenger led at 37% share, closely trailed by domestic super-app Zalo at 30%. International alternatives held smaller footprints, including Skype (21%), Viber (18%), WeChat (12%), and Line (12%).
Why did games capture 85.7% of Google Play top-grossing apps while iOS unlocked non-game monetization?
Global storefront supply in 2017—compiled from AppBrain, Apptrace, Lifewire, and PocketGamer—reflected contrasting willingness to pay upfront across the two major app stores. Google Play hosted over 3.1 million apps, with 92.9% offered free and only 7.1% paid. Apple's App Store carried over 2.2 million apps, yet paid titles accounted for 25.1% of its catalog (74.9% free)—more than 3.5 times Google Play's paid ratio.
By global catalog volume, Games represented 25% of App Store titles and 18% of Google Play apps. Subsequent verticals included Business (9.8% on iOS; 6.7% on Android), Education (9% on iOS; 8% on Android), Lifestyle (8.3% on iOS; 7.1% on Android), Entertainment (6% on iOS; 7% on Android), and Tools/Utilities (4.9% on iOS; 5.2% on Android).
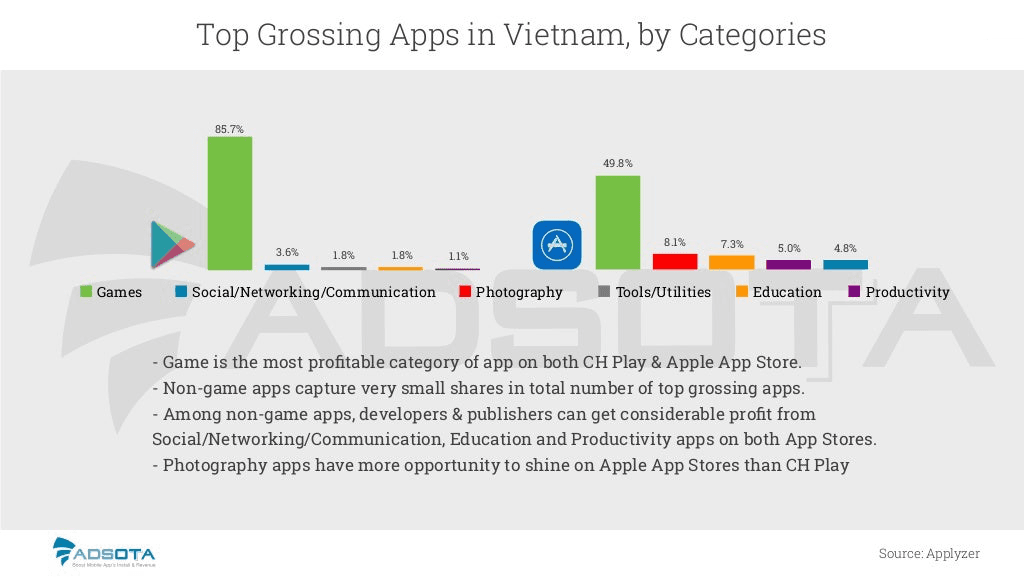
Applyzer's July 2017 breakdown of top-grossing apps in Vietnam reveals a striking platform divergence for non-game publishers seeking direct consumer revenue:
| App Category in Vietnam (Applyzer, July 2017) | Share of Top Grossing on Google Play | Share of Top Grossing on Apple App Store | Monetization Takeaway |
|---|---|---|---|
| Games | 85.7% | 49.8% | Top revenue driver on both stores, dominating Android grossing charts almost completely |
| Photography | Outside top 5 grossing categories | 8.1% | Leading non-game earner on iOS via filter packs and editing subscriptions |
| Education | 1.8% | 7.3% | iOS users converted on language and learning apps at 4x Android's grossing share |
| Productivity | 1.1% | 5.0% | Cloud storage and workflow subscriptions monetized nearly 5x higher on iOS |
| Social, Networking & Communication | 3.6% | 4.8% | Consistent top-five non-game revenue contributor across both storefronts |
| Tools & Utilities | 1.8% | Outside top 5 grossing categories | High Android install volume, but best monetized via ads rather than IAP |
VNG, VTC, Gamota, Money Lover, and Vietnam's 10-pillar mobile ecosystem
Applyzer's July 2017 overall storefront rankings show international publishers dominating Vietnam's Free download charts through casual games (Slither.io, Subway Surfers, My Talking Tom, Temple Run 2) and utility apps. On the Grossing charts, however, Vietnam's top three domestic game publishers—VNG, VTC, and Gamota—contributed numerous flagship MMORPG and strategy titles alongside regional hits from Garena.
Among top Paid apps across both stores in July 2017, personal finance tracker Money Lover stood out as the sole Vietnamese-built application competing alongside paid global titles. In Q2 2017, Google also nominated Money Lover for Google Play Best App at Google I/O 2017, proving local utility developers could build globally competitive subscription and paid products.
Slide 10 maps the 10-pillar domestic ecosystem supporting app distribution and monetization in Q2 2017:
- Domestic and foreign publishers: Local leaders (Gamota, VNG, ME Corp, VTC Game, VTC Mobile, Vega Game, Asiasoft, VTC Online, SohaGame, TeaMobi) competing alongside foreign publishers (Garena, Mobvista, NetEase Games, Gamevil).
- Marketing agencies, social networks, livestreaming, and media: Mobile ad platforms (Adsota, Adtima, Admatic, Admicro, Adways, AdFlex, Ambient Digital, CleverAds, Ecomobi), social apps (Zalo, Facebook, YouTube, Instagram, Line, Skype), livestreaming platforms (Facebook Live, YouTube, Bigo Live, TalkTV), tech press (ICTnews, GenK, VnExpress, CafeF, GameHub.vn, GameK.vn), and industry events (Vietnam Mobile Day, Echelon Vietnam, Bluebird Award).
- Mobile payment, telecom carriers, and cloud infrastructure: Fourteen payment gateways and e-wallets (AppotaPay, OnePAY, Payoo, VTC Pay, Smartlink, Paymentwall, 1Pay, ZaloPay, OnOnPay, MoMo, BaoKim.vn, SohaPay, Moca, NganLuong.vn), four carriers (Viettel, VinaPhone, MobiFone, Vietnamobile), and five cloud/hosting providers (VCCloud, KDATA, Nhan Hoa, vHost, Mat Bao).
Where did Vietnam's USD 0.61 Android and USD 0.71 iOS game CPI stand in Southeast Asia?
Chapter 2 benchmarks user acquisition costs using July 2017 data from Adsota and Chartboost, contrasting Vietnam against the world's most expensive mobile game markets. On Google Play, global peak average Cost Per Install (CPI) reached USD 4.00 in the Solomon Islands, USD 3.11 in Japan, USD 3.09 in Australia, USD 2.51 in Canada, and USD 2.46 in the United States. On Apple's App Store, top global game CPIs were led by Australia (USD 3.68), the United States (USD 3.59), Canada (USD 3.49), Japan (USD 3.44), and New Zealand (USD 3.13).
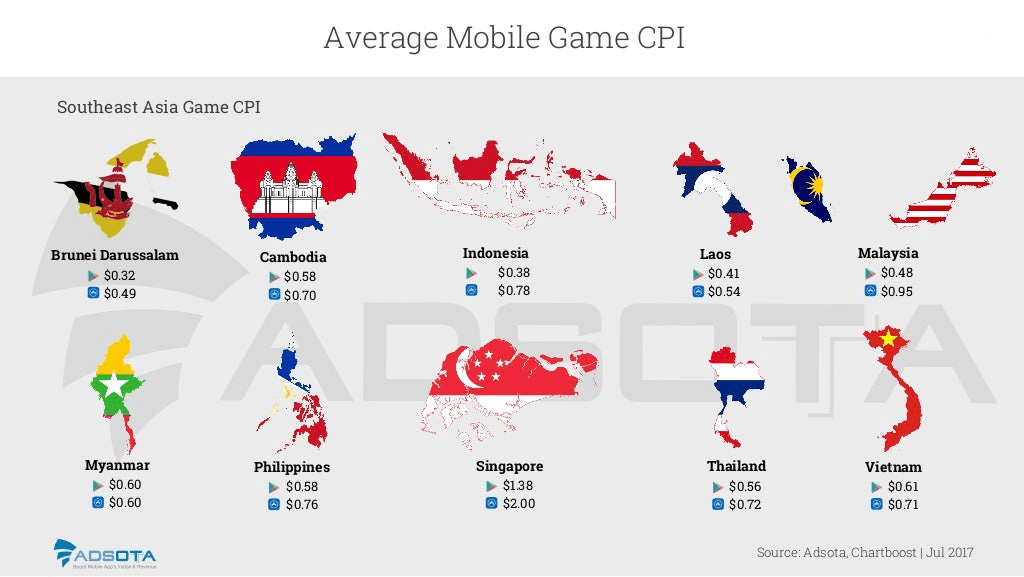
Comparing all 10 Southeast Asian markets tracked by Adsota and Chartboost in July 2017 uncovers an important pricing dynamic on Android:
| Southeast Asian Market (Adsota, Chartboost, July 2017) | Google Play Game CPI (USD) | Apple App Store Game CPI (USD) | iOS Premium Over Android |
|---|---|---|---|
| Singapore | USD 1.38 | USD 2.00 | +USD 0.62 (+44.9%) |
| Malaysia | USD 0.48 | USD 0.95 | +USD 0.47 (+97.9%) |
| Indonesia | USD 0.38 | USD 0.78 | +USD 0.40 (+105.3%) |
| Philippines | USD 0.58 | USD 0.76 | +USD 0.18 (+31.0%) |
| Thailand | USD 0.56 | USD 0.72 | +USD 0.16 (+28.6%) |
| Vietnam | USD 0.61 | USD 0.71 | +USD 0.10 (+16.4%) |
| Cambodia | USD 0.58 | USD 0.70 | +USD 0.12 (+20.7%) |
| Myanmar | USD 0.60 | USD 0.60 | Parity (USD 0.00) |
| Laos | USD 0.41 | USD 0.54 | +USD 0.13 (+31.7%) |
| Brunei Darussalam | USD 0.32 | USD 0.49 | +USD 0.17 (+53.1%) |
Regional UA teams often assume Vietnam's Android game installs are uniformly cheaper than neighboring ASEAN peers. In July 2017, although Vietnam's rates sat four to five times below US and Japanese levels, Vietnam's USD 0.61 Android game CPI was the second highest in Southeast Asia—trailing only Singapore (USD 1.38) and exceeding Thailand (USD 0.56), the Philippines (USD 0.58), Malaysia (USD 0.48), and Indonesia (USD 0.38, by 60%).
Because games accounted for 85.7% of Google Play top-grossing titles in Vietnam, intense bidding among domestic and regional mid-core publishers compressed the gap between Android (USD 0.61) and iOS (USD 0.71) to just USD 0.10. Readers tracking how broader app inventory expansion reshaped install costs over the following two years can compare our 2019 Vietnam Mobile Marketing and Game report and apply our mobile game soft-launch checklist for validating retention and LTV before scaling spend.
How did in-app ads drive 56% of publisher revenue, and how did Vietnam eCPMs trend in H1 2017?
AdColony's Summer 2017 Mobile Publishing Survey (slides 14–16) challenges the assumption that mobile publishers rely primarily on direct user purchases. Across surveyed global publishers, more than half of total revenue (56%) came from in-app advertising (IAA)—split across video ads (31%), display ads (20%), and native ads (5%). Direct in-app purchases (IAP) contributed 39%, while paid installs (2%), subscriptions (1%), mCommerce (1%), and affiliate marketing (1%) accounted for the remaining 5%.
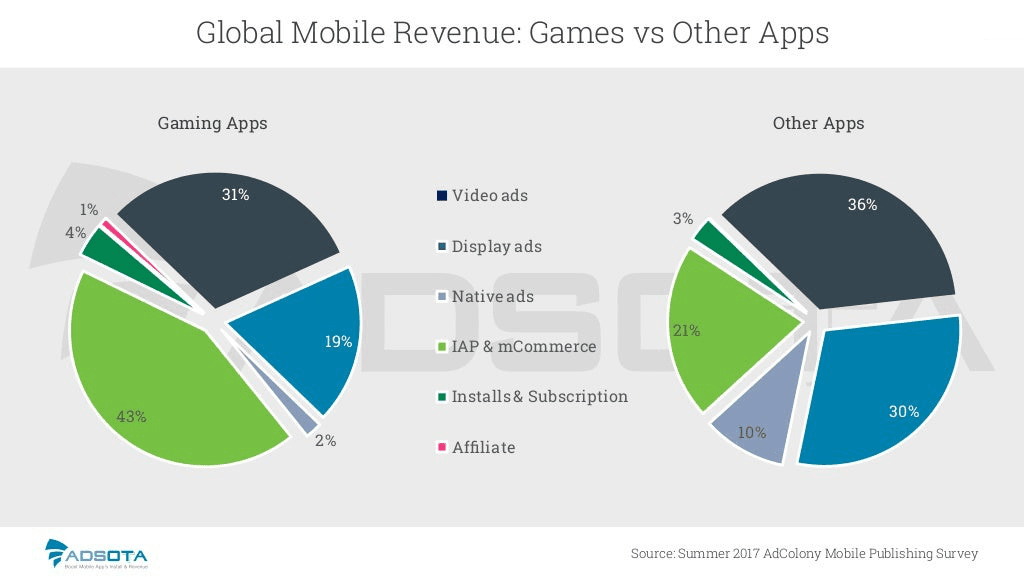
Separating gaming from non-gaming portfolios in AdColony's dataset highlights two distinct monetization architectures:
- Gaming Apps: Operated a balanced hybrid model where IAP and mCommerce generated 43% of revenue, yet combined advertising still held a 52% majority (31% video ads, 19% display ads, 2% native ads), supplemented by paid installs/subscriptions (4%) and affiliate revenue (1%).
- Non-Gaming (Other) Apps: Relied overwhelmingly on advertising for 76% of revenue (36% video ads, 30% display ads, and 10% native ads—five times games' native share), with 21% from IAP/mCommerce and 3% from installs and subscriptions.
Why 75% of publishers rank rewarded video as the most effective format
When publishers ranked the most effective monetization methods (AdColony, Summer 2017), rewarded video ads led at 75%, outscoring IAP (63%), interstitial video (44%), playable ads (32%), interstitial display (31%, misprinted as interstitial payable on slide 15), native ads (26%), banner display (24%), preroll video (22%), paid downloads (14%), paid subscriptions (14%), in-feed video (13%), and affiliate (6%). For user experience delivery, 87% of publishers named rewarded video the best UX format—nearly triple native ads (32%) and interstitial display (32%), and well ahead of playable ads (24%), banners (24%), interstitial video (21%), in-feed video (17%), and preroll video (11%).
Monthly eCPM performance across four ad formats in Vietnam (January–June 2017)
To benchmark local ad yield (effective Cost Per Mille — eCPM), slides 17–20 track monthly H1 2017 payouts in Vietnam from AppotaX and Appodeal. Across every format, iOS inventory commanded substantially higher eCPMs than Android, particularly in full-screen interstitial and video placements.
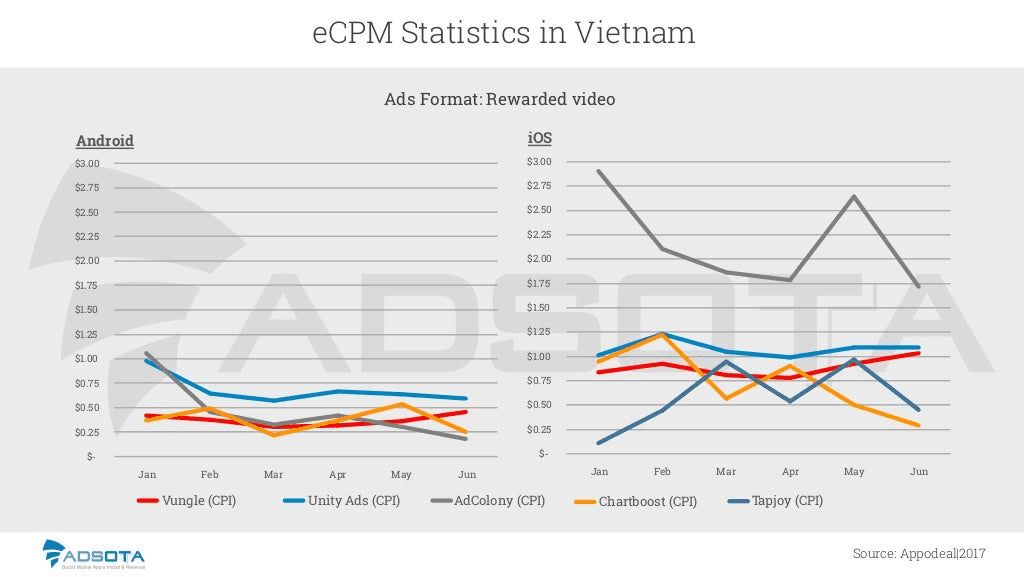
AppotaX and Appodeal's six-month trajectories reveal sharp network divergence across formats:
| Vietnam Ad Format (H1 2017) | Android Monthly eCPM Range (USD Gridlines) | iOS Monthly eCPM Range (USD Gridlines) | Top-Yielding Networks in Vietnam |
|---|---|---|---|
| Banners (AppotaX, Appodeal) | Google DFP climbed from ~USD 0.09 (Jan) to ~USD 0.35 (Apr) and held USD 0.32–0.34 (May–Jun); Facebook rose to USD 0.10–0.13 in Q2; AdMob stayed flat at USD 0.07–0.09; Smaato fell from USD 0.16 to USD 0.04 | Google DFP led all six months at USD 0.18–0.28 (peaking in Jun); AdMob hit ~USD 0.17 in Feb–Mar before dropping below USD 0.04 in Q2; Facebook and Smaato stayed under USD 0.06 | Google DFP led both OSs by roughly 2–3x via exchange demand |
| Interstitials (AppotaX, Appodeal) | Google DFP led from Feb onward at USD 0.80–0.96; Facebook and AdMob tracked at USD 0.45–0.66; InMobi fell from ~USD 1.05 (Jan) below USD 0.20 (Jun); Chartboost ranged USD 0.10–0.34 | Roughly 2–3x Android: Google DFP held USD 1.70–1.90 in Q1 and USD 1.25–1.50 in May–Jun; AdMob surged from ~USD 0.72 (Jan) to ~USD 2.35 (May); InMobi touched ~USD 0.78 in May | Google DFP and AdMob led iOS; Google DFP led Android |
| Rewarded Video (Appodeal) | AdColony and Unity Ads opened Jan near USD 1.00; in Q2 Unity Ads led steadily at USD 0.58–0.66 while Vungle, Chartboost, and AdColony ranged USD 0.18–0.54 | Highest-earning format: AdColony led throughout at ~USD 1.72 to nearly USD 2.90 (Jan peak ~USD 2.90, May rebound ~USD 2.64); Unity Ads held USD 1.00–1.24; Vungle rose to USD 1.04 in Jun | AdColony and Unity Ads led iOS; Unity Ads anchored Q2 Android yield |
| Non-Rewarded Video (Appodeal) | AdColony led all six months at USD 0.63–0.93 (holding ~USD 0.75–0.78 across Mar–Jun), ahead of Unity Ads (USD 0.43–0.75) and Vungle (USD 0.25–0.48) | AdColony declined from USD 2.75 (Jan) to ~USD 1.08 (Jun); Unity Ads peaked at USD 1.38–1.40 in Feb–Mar before settling at USD 0.75–0.88 in Q2; Vungle peaked near USD 1.21 in Mar | AdColony led both OSs, though iOS non-rewarded video compressed in Q2 |
Vietnam's seven-layer programmatic stack and AppotaX exchange monetization
Month-to-month eCPM swings demonstrate why relying on a single hardcoded ad SDK leaves revenue on the table. Slide 21 organizes Vietnam's 2017 Programmatic Mobile Ads Ecosystem into seven interconnected technology layers:
- General and video-oriented ad networks: Multi-format networks (AdMob, Facebook Audience Network, AppLovin, Fyber, Heyzap, AppBrain SDK, Appnext, StartApp, MoPub, DoubleClick for Publishers, Smaato, Ecomobi) paired with specialized video networks (AdColony, Tapjoy, Chartboost, Unity Ads, InMobi, Vungle).
- Ad mediation and ad exchanges: Mediation platforms (Appodeal, ironSource, MoPub, AdMob, Heyzap, Smaato, OpenX, Mobvista, Affle, DFP) dynamically routing impressions into exchanges led by AppotaX (Appota's publisher optimization solution on Google Ad Exchange, exclusively commercialized by Adsota since 2017), DFP, OpenX, ANTS, MOG, and MoPub.
- DSPs, SSPs, and attribution analytics: Demand-side platforms (Sociomantic, ANTS, Geniee, MicroAd BLADE, Ureka Media), supply-side platforms (ANTS, OpenX, DFP, PubMatic, Rubicon Project, AppNexus), and mobile measurement partners (AppsFlyer, Adjust, Kochava, App Annie, Google Analytics, and MobileAppTracking by TUNE). How programmatic and mobile video budgets scaled subsequently is detailed in our 2019 Vietnam digital advertising market report by Adsota.
What did Q2 2017 DFP updates and LTV user quality indicators require from publishers?
Chapter 3 reviews major Q2 2017 platform releases from Google and Facebook that reshaped mobile inventory management. Across DFP Premium and Google Ad Exchange, seven release milestones between April 3 and June 26, 2017 introduced three structural shifts:
- Measurement standardization and legacy deprecation: The April 3 update advanced Flash deprecation, revised Ad Exchange impression-counting methodology, launched the in-app DFP Delivery Inspector, and deprecated legacy Ad Network Optimization. On May 1, Google added MRC accreditation labeling and enforced mandatory end dates for Preferred Deals.
- Programmatic Guaranteed and native/video tooling: On April 17, Google rolled out Programmatic Guaranteed alongside new Size and Demand Channel reporting dimensions and Deal Check filters against invalid advertisers. Subsequent May 15 and May 30 releases added simulate video ad requests, programmatic native styling controls, and open-beta tracking URLs for third-party and DoubleClick creatives.
- Ad experience enforcement: The June 12 release integrated Better Ads Standards and a new Ad Exchange sensitive category ahead of June 26 programmatic proposal notification upgrades.
Concurrently in Q2 2017, Facebook introduced full-width ads on Audience Network, new Canvas Ads templates, and Instant Games inside Messenger, while Google unveiled VR Ads experiments.
Seven user quality indicators driving LTV and four execution priorities
Closing the report on slide 25, Adsota's Lifetime Value (LTV) Success spotlight cites AdColony's Summer 2017 publisher survey to identify which post-install signals best predict long-term monetization. Surveyed publishers ranked Retention (over 80%), Early IAP behavior (nearly 70%), and Average session duration (around 45%) as the three strongest indicators of user quality—ahead of positive store reviews (over 40%), session frequency (around 34%), social login (around 24%), and tutorial completion (over 20%).
To lift those metrics systematically, Adsota outlines a six-lever LTV framework: UA strategy optimization, cross-app deep linking, onboarding flow refinement, UI improvement, continuous user interaction, and smart push notifications. Growth teams can explore additional cross-channel acquisition frameworks in our Marketing and Creator insights topic hub.
Drawing on Adsota's Q2 2017 findings, mobile publishers and UA managers should execute four immediate priorities:
- Carve out dedicated iOS acquisition and monetization tiers in Vietnam: Look past Apple's 8.9% new-handset sales share and target Vietnam's 29.4% active iOS phone base and 73.1% iPad base—where non-game subscriptions (photography, education, productivity) and in-app eCPMs run 2–3x higher than Android.
- Anchor ad monetization on mediated rewarded video and exchange demand: Prioritize opt-in rewarded video (75% effectiveness, 87% positive UX) connected through mediation and Google DFP / AppotaX exchange bidding to capture USD 0.58–0.66 Android eCPMs and USD 1.00–2.90 iOS eCPMs.
- Gate Android game UA scaling on early retention and IAP payback: Because Vietnam's USD 0.61 Android game CPI ranked second highest in ASEAN (just USD 0.10 below iOS), studios must validate retention and early IAP conversion rather than chasing raw install volume.
- Audit placements for Better Ads compliance and legacy Android builds: Replace intrusive interstitials before exchange filtering penalizes fill rates, and test APK memory footprints across KitKat 4.4 through Marshmallow 6.0 devices (over 78% of active Android versions).
Submit the download form on this page to access the full 27-slide Vietnam Mobile App Advertising & Monetization Report (Q2-2017) PDF deck from Adsota, including complete ecosystem maps and monthly eCPM charts.
Sources
- Vietnam Mobile App Advertising & Monetization Report (Q2-2017) — Báo cáo thị trường quảng cáo di động Việt Nam Quý 2/2017, Công ty Cổ phần Adsota (Adsota — Creative Marketing Agency under Appota Group), 2017-08-17, accessed 2026-10-31
- Global & Vietnam Operating System, Browser & Search Engine Market Share (May 2017) and H1 2017 Mobile Brand Purchases, StatCounter Global Stats, Appota & GfK, 2017-05-31, accessed 2026-10-31
- Digital in 2017: Vietnam Social Network & Messenger/Chat App/VOIP Market Share, We Are Social & Statista, 2017-01-31, accessed 2026-10-31
- Number of Applications Available on Google Play and Apple App Store by Category (2017), AppBrain, Apptrace, Lifewire & PocketGamer, 2017-07-01, accessed 2026-10-31
- Top Overall Apps and Top Grossing Apps by Category in Vietnam (Google Play & Apple App Store, July 2017), Applyzer, 2017-07-15, accessed 2026-10-31
- Global & Southeast Asia Average Mobile Game Cost Per Install (CPI) Benchmarks (July 2017), Chartboost & Adsota, 2017-07-31, accessed 2026-10-31
- Summer 2017 Mobile Publishing Survey — Revenue Sources, Monetization Effectiveness, User Experience & LTV Quality Indicators, AdColony (nay thuộc Digital Turbine), 2017-07-20, accessed 2026-10-31
- Vietnam In-App Advertising eCPM Statistics Across Banners, Interstitials, Rewarded Video & Video (H1 2017), AppotaX & Appodeal, 2017-07-15, accessed 2026-10-31
- DFP Premium and Google Ad Exchange Releases Archive & Platform Highlights (Q2 2017), Google DoubleClick for Publishers (DFP) & Adsota, 2017-06-30, accessed 2026-10-31