
Vietnam Mobile Market Report Q3 2017
Appota's Q3 2017 report on the mobile market in Vietnam analyzes a 46% smartphone penetration rate (67% Android, 29% iOS) across 53 million internet users. Samsung captured 70% of top-selling handsets, Honour of Kings and Lords Mobile led game monetization, Shopee reached 10 million app installs, and 88% of online shoppers paid via cash on delivery (COD).
Analysis of 53 million internet users, 46% smartphone penetration, the 33-app monthly lifecycle, local game publisher share (26.22%), the Lazada vs. Shopee race, and 88% COD payments in Vietnam in Q3 2017.
Key findings
- 53M Internet & 46% smartphoneAcross a total population of 93.7 million in Q3 2017, Vietnam recorded 53 million internet users with an average internet connection speed of 6.2 Mbps, a 46% smartphone penetration rate, and 46 million active social network users; mobile operating system market share split across 67% Android, 29% iOS, and 4% Other (Appota).
- +5% YoY & 57.7M regional unitsEmerging Asia sold 57.7 million smartphones in Q3 2017 (+5% YoY in unit volume from 55.2 million and +21% YoY in sales value from $8.7 billion to $10.5 billion) out of 366.6 million global units (+3% YoY, reaching $116.8 billion); Vietnam's smartphone sales grew 5% YoY in Q3 2017 but dipped slightly quarter-over-quarter due to Ghost Month (tháng cô hồn) and Ho Chi Minh City's rainy season (GfK).
- 70% Samsung market shareSamsung dominated Vietnam's mobile phone market in Q3 2017 with a 70% share, capturing 7 of the Top 10 best-selling handsets at Thế Giới Di Động (led by the Galaxy J2 Prime, J7 Prime, and J7 Pro) and 5 of the Top 10 at FPT Shop (led by the J7 Pro); Oppo held top positions with the A37 and F3, while the Vivo V7+, Huawei Nova 2i, and Xiaomi Mi A1 emerged as mid-range rising stars (Appota, FPT Shop, Thế Giới Di Động).
- 33 apps (+5 / -3 monthly)Vietnamese smartphone users kept an average of 33 apps installed but opened only 8 of 33 apps daily, while installing 5 new apps and uninstalling 3 apps each month; Games led both the Top 5 installed categories (69%, ahead of Social networking at 68% and Messaging at 66%) and the Top 5 uninstalled categories (58%, ahead of Books/comics at 46% and Shopping at 43%) (Appota).
- +53% Honour of Kings & +23% LordsIn Q3 2017 storefront rankings, Lords Mobile (+23%) and Honour of Kings / Liên Quân Mobile (+53%) led Top 5 app revenue alongside Rise of the Kings (+110%) and iCá (+88%); conversely, free download volumes across the Top 5 titles declined between 1% and 33% quarter-over-quarter, led by Honour of Kings (-1%) and My Talking Tom (-6%) (Appota).
- 26.22% local publisher shareVietnamese game publishers accounted for only 26.22% of total domestic game installs in Q3 2017, ahead of publishers from the United States (23.89%) and China (13.96%) while trailing the combined Other international segment (35.93%); among local publisher downloads (plotted from 369,557 to 29,052,686 installs), Game Casino (20.44%), Casual (19.93%), and Game Action (16.83%) captured the largest shares (Appota).
- 35% Lazada vs. 33% ShopeeMobile e-commerce shoppers in Vietnam were 64% female (36% male), concentrated in the 18–25 (34%) and 26–30 (30%) age brackets and residing primarily in Ho Chi Minh City (38%) and Hanoi (17%); Lazada led shopping app install share at 35% and ranked #1 in brand recall across all 4 categories (Fashion 52%, Beauty 34%, Food 22%, Electronics 38%), while Shopee followed closely at 33% with roughly 10 million app installs (Appota, Q&Me).
- 88% COD & 30M+ Appota usersCash on delivery (COD) accounted for 88% of e-commerce transactions in Vietnam, far ahead of credit/debit cards (6%), bank transfers (5%), and e-wallets such as MoMo, Ngân Lượng, and Bảo Kim (1%); the report draws on Appota's ecosystem of over 30 million users and 15,000+ global partners across Gamota, Adsota, and AppotaPay (Q&Me, Appota).
How Did Handset Sales and OS Share Shape the Mobile Market in Vietnam in Q3 2017?
Compiled on December 7, 2017 by Appota Joint Stock Company (Appota Group), the Q3 2017 report on the mobile market in Vietnam (Vietnam Mobile Report Q3-17) delivers quantitative benchmarks covering smartphone hardware, mobile games, mobile e-commerce, and digital payments. Across 13 widescreen slides, the study combines operational telemetry from Appota's ecosystem of more than 30 million users and over 15,000 partners (spanning Gamota, Adsota, and AppotaPay) with market tracking from GfK, FPT Shop, Thế Giới Di Động, and Q&Me.
Readers following our Gaming research can compare this Q3 2017 baseline against the Vietnam Mobile App Market Report First Half of 2018 to trace how smartphone penetration expanded from 46% toward nationwide 4G adoption. Chapter 1 (slides 3–5) examines Vietnam's digital population, regional handset sales cyclicality, and top-selling smartphones at leading retail chains.
Android Holds 67% OS Share as Smartphone Penetration Reaches 46% of the Population
According to slide 3 (Mobile OS Market Share in Vietnam), Vietnam's total population stood at 93.7 million (93.7 M) in Q3 2017. Active internet users reached 53 million (representing 56.56% of the population), supported by an average internet connection speed of 6.2 Mbps (printed on the slide graphic as 6.2 Mpbs).
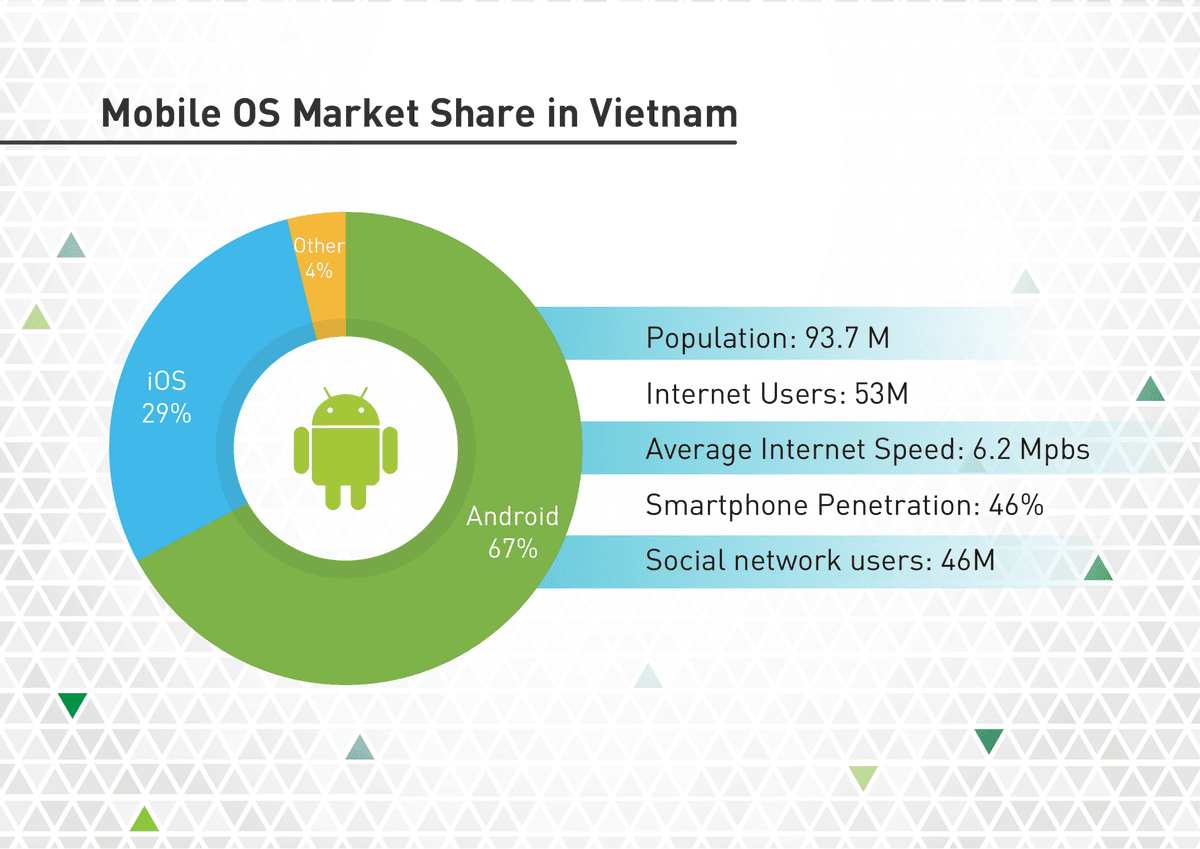
Nationwide smartphone penetration reached 46%, while active social network users numbered 46 million (accounting for 86.79% of all internet users). Across active mobile operating systems, Android led with a 67% market share, iOS held 29%, and Other operating systems accounted for the remaining 4%.
Vietnam Smartphone Sales Grow 5% YoY Despite Ghost Month and Rainy-Season Headwinds
On slide 4 (Vietnam Smartphone Growth to compare with other countries), the report cites point-of-sales tracking from GfK (3Q 2017 vs. 3Q 2016) to benchmark Vietnam against global regions. Worldwide smartphone unit sales reached 366.6 million units in Q3 2017, up 3% year-on-year (YoY) from 355.4 million units in Q3 2016. Global smartphone sales value rose 10% YoY from $106.3 billion to $116.8 billion.
| Global Region (Slide 4 — Source: GfK) | 3Q17 Units Sold (Millions) | 3Q16 Units Sold (Millions) | Unit YoY % Change | 3Q17 Sales Value (USD Billions) | 3Q16 Sales Value (USD Billions) | Value YoY % Change |
|---|---|---|---|---|---|---|
| Western Europe | 30.9 | 33.2 | -7% | $13.7B | $13.2B | +4% |
| Central & Eastern Europe (C & E Europe) | 22.3 | 20.5 | +9% | $5.4B | $4.3B | +26% |
| North America | 49.3 | 50.0 | -1% | $19.1B | $18.9B | +1% |
| Latin America | 27.8 | 25.1 | +11% | $8.8B | $7.8B | +13% |
| Middle East & Africa | 45.2 | 41.9 | +8% | $10.7B | $10.2B | +5% |
| China | 117.0 | 111.9 | +5% | $38.3B | $31.9B | +20% |
| Developed Asia | 16.4 | 17.6 | -7% | $10.3B | $11.3B | -9% |
| Emerging Asia (Highlighted) | 57.7 | 55.2 | +5% | $10.5B | $8.7B | +21% |
| Global Total | 366.6 | 355.4 | +3% | $116.8B | $106.3B | +10% |
Across Emerging Asia (highlighted in a red dashed border on slide 4), consumers purchased 57.7 million smartphones in Q3 2017, representing a 5% YoY increase in unit volume from 55.2 million in Q3 2016 and a 21% YoY surge in sales value from $8.7 billion to $10.5 billion. Regional growth was propelled by strong demand in Malaysia and Bangladesh, both of which expanded by more than 20% YoY.
In Vietnam, smartphone demand increased 5% YoY during Q3 2017 but declined slightly compared with preceding quarters. The report attributes this quarterly dip to two seasonal factors: Ghost Month (tháng cô hồn, the seventh lunar month when consumers traditionally avoid major purchases) and the rainy season in Ho Chi Minh City (HCMC). Because the third quarter is historically the lowest-revenue period of the year for handset retailers, phone shops conserve marketing budgets during Q3 to fund year-end holiday promotions in Q4.
Samsung Commands 70% Market Share While Vivo, Huawei, and Xiaomi Rise in the Mid-Range
Slide 5 (Vietnam Mobile Phone Market Share in Q3 — Big players in Vietnam 3Q17) details brand competition and the Top 10 best-selling handsets across Vietnam's two largest retail chains, FPT Shop and Thế Giới Di Động:
- Samsung dominates with a 70% market share: Led by the Galaxy J7 Prime, J5 Prime, J2 Prime, J7 Pro, and Galaxy A5, Samsung captured 7 of the Top 10 best-selling positions at Thế Giới Di Động (matching the 70% share benchmark) and 5 of the Top 10 positions at FPT Shop.
- Oppo defends upper-chart slots while Apple's iPhone 6 32GB endures: Oppo maintained strong retail traction with its selfie-focused F1s, A37, A39, F3, and F3 Lite models, claiming #2 and #3 at FPT Shop and #4 and #5 at Thế Giới Di Động. Meanwhile, Apple competed via the iPhone 7 Plus (128GB), iPhone 5s (16GB), and especially the refreshed iPhone 6 (32GB), which ranked #4 at FPT Shop and #10 at Thế Giới Di Động.
- Three mid-range rising stars (New Stars): Slide 5 highlights the Vivo V7+, Huawei Nova 2i, and Xiaomi Mi A1 as fast-rising contenders in the mid-range segment, while the Vivo Y55S entered FPT Shop's Top 10 at #8.
| Rank (STT) | Top 10 Best-Sellers at FPT Shop (Slide 5) | Top 10 Best-Sellers at Thế Giới Di Động (Slide 5) | Price Tier & Brand Positioning |
|---|---|---|---|
| 1 | Samsung J7 Pro | Samsung J2 Prime | Mid-range & Entry-level (Samsung leads both chains) |
| 2 | Oppo A37 | Samsung J7 Prime | Entry-level Oppo / Mid-range Samsung |
| 3 | Oppo F3 | Samsung J7 Pro | Dual-selfie mid-range Oppo / Mid-range Samsung |
| 4 | iPhone 6 - 32GB | Oppo A37 | 2017 iPhone 6 32GB edition / Entry-level Oppo |
| 5 | Samsung J2 Prime | Oppo F3 | Entry-level Samsung / Mid-range Oppo |
| 6 | Samsung J7 Prime | Samsung J5 Prime | Core Galaxy J Prime volume drivers |
| 7 | Oppo F3 Lite | Samsung J3 LTE | Mid-range Oppo / Entry-level 4G LTE Samsung |
| 8 | Vivo Y55S | Samsung J3 Pro | Vivo enters FPT Shop Top 10 / Entry-level Samsung |
| 9 | Samsung J3 Pro | Galaxy A5 2017 | Entry-level & Upper-mid-range Samsung |
| 10 | Samsung J5 Prime | iPhone 6 32GB | Samsung J5 Prime / iPhone 6 32GB at Thế Giới Di Động |
How Did the 33-App Lifecycle and Local Game Publishers Perform in the Mobile Market in Vietnam?
Chapter 2 (slides 6–8, Mobile App - Game) examines monthly app churn, storefront revenue and download leaders, and the market share of domestic game publishers.
Users Open Only 8 of 33 Installed Apps Daily as Games Top Both Installs (69%) and Uninstalls (58%)
Slide 6 illustrates the 1-month (1 month) application lifecycle on Vietnamese smartphones. On average, users kept 33 apps installed on their devices but actively opened only 8 out of 33 apps daily (Use Daily, or 24.24%). Each month, a typical user installed 5 new apps (New Install each month) and removed 3 apps (Uninstall each month), resulting in a 60% monthly uninstall-to-install ratio.
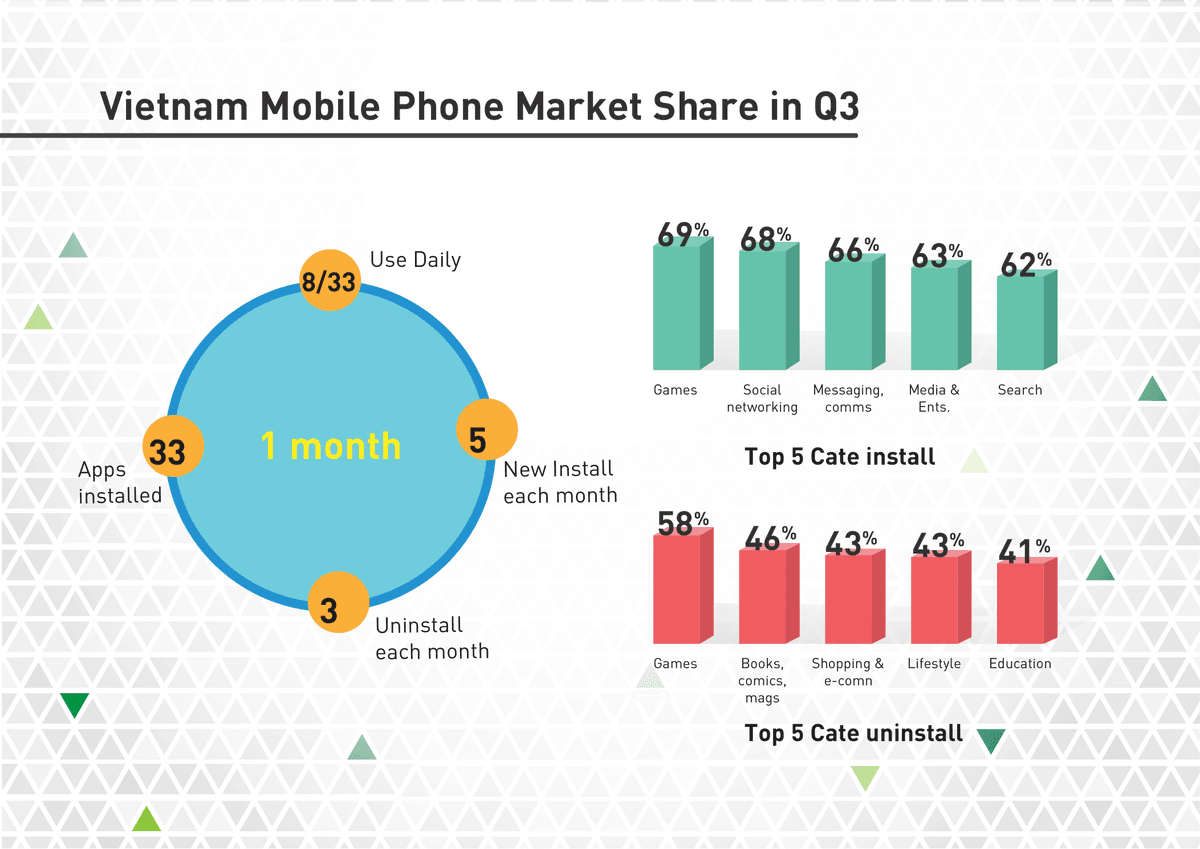
The two bar charts on the right side of slide 6 underscore high user turnover across mobile content categories:
- Top 5 Installed Categories (Top 5 Cate install): Games ranked first at 69%, closely followed by Social networking at 68%, Messaging, comms at 66%, Media & Ents. (Media & Entertainment) at 63%, and Search at 62%.
- Top 5 Uninstalled Categories (Top 5 Cate uninstall): Games also topped the uninstallation chart at 58%, ahead of Books, comics, mags at 46%, Shopping & e-comn (Shopping & E-commerce) at 43%, Lifestyle at 43%, and Education at 41%.
Honour of Kings and Lords Mobile Drive Revenue Growth While Top Free Downloads Soften
Slide 7 (Top Revenue/Download Apps in 3Q17) compares the Top 5 revenue-generating apps and Top 5 free-download apps in Vietnam during Q3 2017:
| Rank | Top 5 Revenue Apps | Publisher | QoQ Revenue Change | Top 5 Free Download Apps | Publisher | QoQ Download Change |
|---|---|---|---|---|---|---|
| 1 | Lords Mobile | IGG | +23% | Honour of Kings (Liên Quân Mobile) | Tencent | -1% |
| 2 | Honour of Kings (Liên Quân Mobile) | Tencent | +53% | My Talking Tom | Outfit7 | -6% |
| 3 | Rise of the Kings | Onemt | +110% | CrossFire | Tencent | -33% |
| 4 | iCá - Ban Ca Online | VNG | +88% | Subway Surfers | Kiloo | -7% |
| 5 | Clash of Kings | Elex Technology | -20% | Zombie Tsunami | MobiGame | -9% |
The storefront metrics on slide 7 highlight two diverging trends:
- Slight contraction in Top 5 free download volumes: All five leading free-to-play titles recorded quarter-over-quarter download declines ranging from -1% to -33%. Aside from the MOBA eSports title Honour of Kings (Liên Quân Mobile, edging down 1%) and shooter title CrossFire (down 33%), the remaining three leaders were evergreen casual games: My Talking Tom (-6%), Subway Surfers (-7%), and Zombie Tsunami (-9%).
- Strong monetization in strategy and eSports: IGG's strategy title Lords Mobile claimed #1 in Q3 2017 revenue with +23% growth (while Onemt's Rise of the Kings surged +110% at #3 and Elex Technology's Clash of Kings fell -20% at #5). Meanwhile, Honour of Kings (Liên Quân Mobile) climbed to #2 in overall revenue (+53%) alongside VNG's casual fish-shooting title iCá - Ban Ca Online at #4 (+88%), proving that competitive eSports titles could scale both mass downloads and top-tier grossing revenue in Vietnam.
Vietnamese Publishers Capture Only 26.22% of Domestic Game Installs
Slide 8 (Local Publishers' app performance) evaluates domestic game distribution by genre and by publisher country of origin. International and local studios planning mobile game publishing in Vietnam can use these figures to gauge market competition.
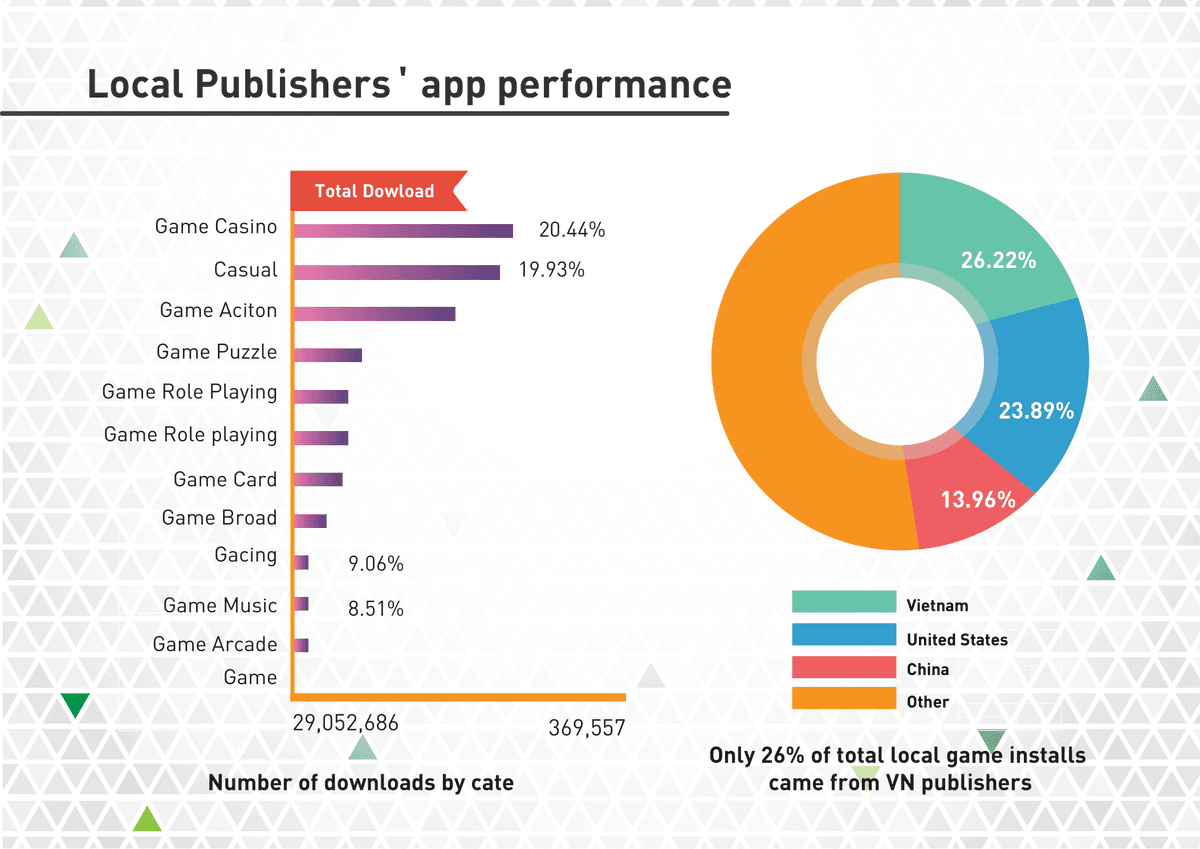
On the right donut chart, total Q3 2017 game installs in Vietnam split across four publisher origin groups:
- Vietnamese publishers (Vietnam): Accounted for 26.22% of total domestic game installs (summarized in the slide callout as: "Only 26% of total local game installs came from VN publishers").
- United States publishers (United States): Ranked a close second at 23.89% of installs.
- Chinese publishers (China): Accounted for 13.96% of direct storefront installs.
- Other international publishers (Other): The unlabelled orange segment represented the remaining 35.93% of installs (
100% - 64.07%).
| Local Publisher Genre Label (Slide 8) | Printed / Hidden PDF Layer Share | Plotted Bar Length (px at 150 DPI) | Slide 8 Data & Typesetting Notes (Axis: 369,557 to 29,052,686 Downloads) |
|---|---|---|---|
| Game Casino | 20.44% (visible) | 441 px | Top-downloaded genre for local publishers (left axis origin 29,052,686) |
| Casual | 19.93% (visible) | 420 px | Second largest genre, accounting for nearly one-fifth of downloads |
| Game Action (printed Game Aciton) | 16.83% (white PDF text layer) | 232 px | Third-longest bar; label Game Action 16.83% is colored white on white background |
| Game Racing (printed Gacing) | 9.06% (visible) | 149 px | Listed 9th from top but plotted as 5th-longest bar with a visible 9.06% label |
| Game Music | 8.51% (visible) | 150 px | Listed 10th from top with a visible 8.51% label matching Racing bar length |
| Game Card | 7.92% (white PDF text layer) | 67 px | Listed 7th from top; label Game Card 7.92% is colored white in the PDF layer |
| Game Board (printed Game Broad) | 5.38% (white PDF text layer) | 44 px | Listed 8th from top; label Game Board 5.38% is colored white in the PDF layer |
| Game Puzzle / Role Playing / Arcade / Game | No % label printed | 95 / 75 / 75 / 17 px | Includes Game Puzzle, two Game Role Playing rows, Game Arcade, and 369,557 |
As shown on the left bar chart of slide 8 (where the horizontal axis spans from 29,052,686 on the left to 369,557 on the right), domestic publishers generated over 40% of their downloads from lightweight Game Casino (20.44%) and Casual (19.93%) titles, followed by Game Action (16.83%), Game Racing (9.06%), Game Music (8.51%), Game Card (7.92%), and Game Board (5.38%), while mid-core Role Playing titles represented a much smaller share of local publisher install volume.
How Did Lazada (35%) and Shopee (33%) Compete in Vietnam's Mobile E-Commerce Market?
Chapter 3 (slides 9–11, Mobile Ecommerce) examines mobile shopper demographics, the transition from desktop to mobile shopping, and marketplace brand leadership.
Female Shoppers (64%), Ages 18–25 (34%), and HCMC–Hanoi (55%) Anchor Mobile E-Commerce
Slide 9 breaks down Vietnam's mobile e-commerce user base across three demographic dimensions:
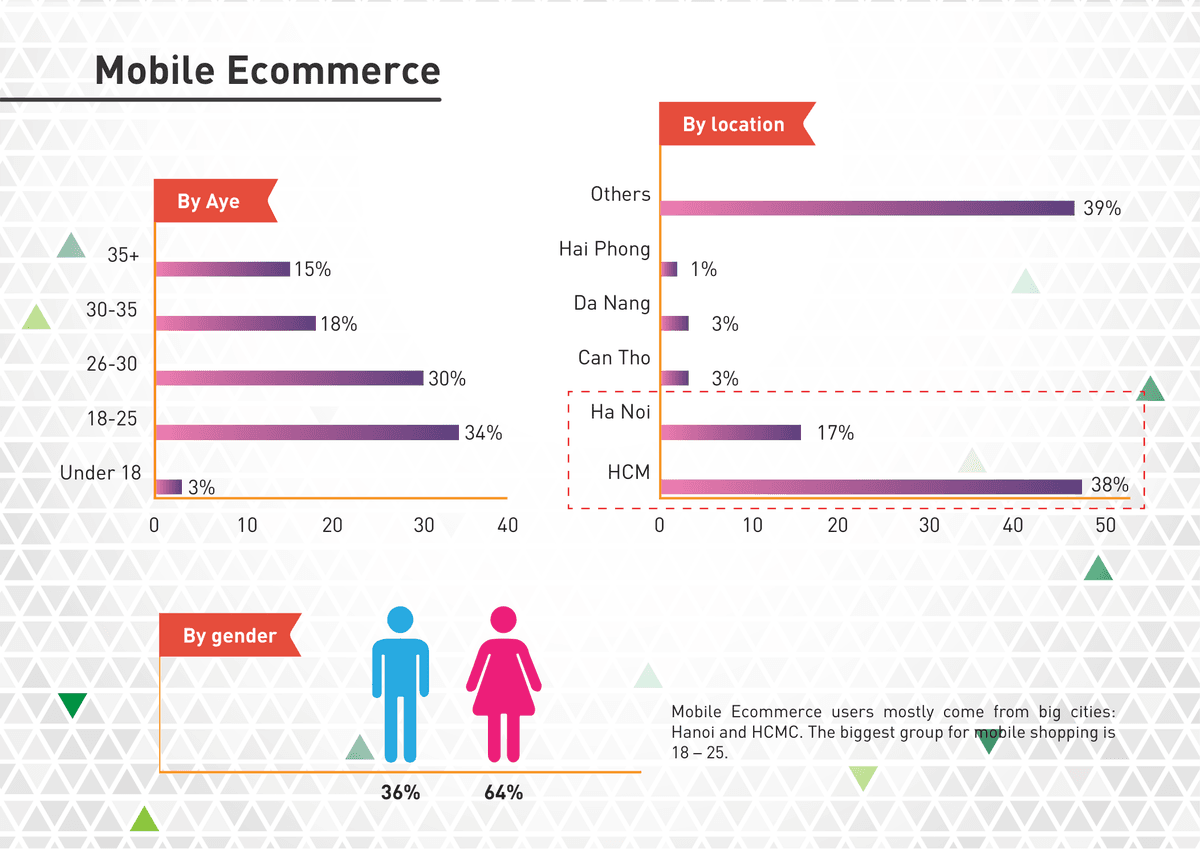
- By Age (By Aye on slide header): Young adults aged 18–25 formed the largest shopping cohort at 34%, followed by the 26–30 bracket at 30%. Combined, shoppers aged 18–30 accounted for 64% of mobile e-commerce users. Consumers aged 30–35 represented 18%, those aged 35+ held 15%, and users Under 18 accounted for 3%.
- By Location (By location): Mobile shoppers were heavily concentrated in Vietnam's two largest metropolitan areas (enclosed in a red dashed box): Ho Chi Minh City (
HCM) accounted for 38% and Hanoi (Ha Noi) represented 17%, totaling 55% nationwide. Secondary cities Da Nang (3%), Can Tho (3%), and Hai Phong (1%) contributed 7% combined, while Others (other provinces) accounted for 39%. - By Gender (By gender): Female shoppers accounted for 64% of mobile e-commerce users, outnumbering male shoppers (36%) by nearly 1.8 to 1.
Smartphones Overtake Home PCs as Shopee Hits 10 Million App Installs (33% Share)
On slide 10 (Device to shop online), the left clustered column chart (Smartphone on the increase) compares online shopping devices between 2016 (blue bars) and 2017 (orange bars) across four channels:
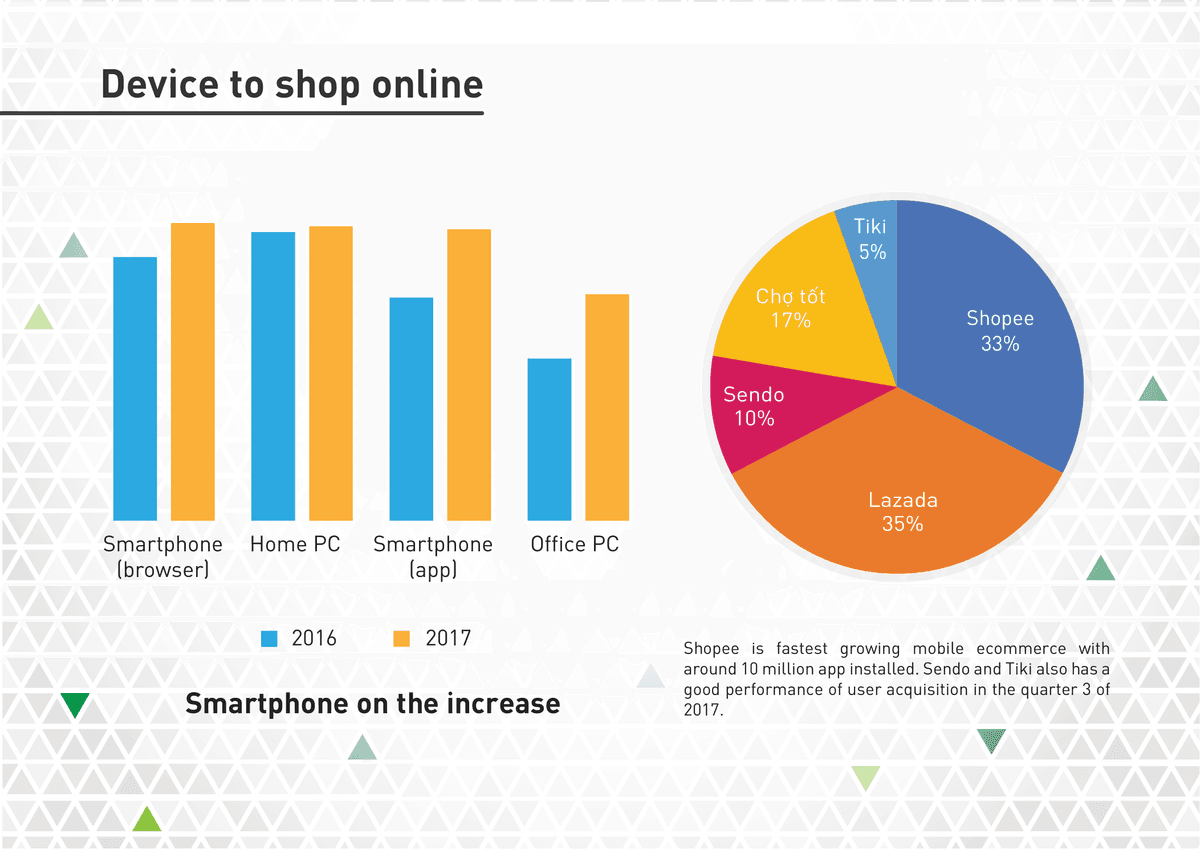
- Smartphone (browser) overtakes Home PC as the #1 channel in 2017: In 2016, Home PC led all online shopping channels (plotted bar height 202.60 pt versus 185.07 pt for Smartphone browser). By 2017, Smartphone (browser) rose to 208.89 pt, surpassing Home PC (206.70 pt).
- Smartphone (app) posts the fastest growth: Shopping via dedicated Smartphone (app) platforms surged from 156.60 pt in 2016 to 204.51 pt in 2017 (+30.6% in plotted bar height), nearly matching Home PC usage, while Office PC usage also increased from 113.89 pt to 159.06 pt.
On the right pie chart of slide 10, mobile e-commerce app installation share in Q3 2017 reflected a tight two-horse race at the top:
- Lazada leads at 35%: Maintained the largest installed base among mobile shopping apps in Vietnam.
- Shopee surges to 33% (~10 million app installs): Emerged as Vietnam's fastest-growing mobile e-commerce marketplace with around 10 million apps installed, narrowing Lazada's lead to just 2 percentage points.
- Domestic platforms capture the remaining 32%: Classifieds marketplace Chợ Tốt held 17%, while Vietnamese marketplaces Sendo (10%) and Tiki (5%) both delivered strong user acquisition performance during Q3 2017.
Lazada Leads Brand Recall Across All Four Product Categories in Q&Me's Survey
Slide 11 (Popular online shops — shops that comes up with each category, source: Q&Me) ranks the Top 4 online shopping destinations associated with each product category across all respondents (All), males (M), and females (F):
| Rank | Fashion Category | Beauty Care Category | Food Category | IT / Electronics Category |
|---|---|---|---|---|
| No. 1 | Lazada (All: 52% · M: 59% · F: 47%) | Lazada (All: 34% · M: 44% · F: 27%) | Lazada (All: 22% · M: 28% · F: 18%) | Lazada (All: 38% · M: 42% · F: 35%) |
| No. 2 | Shopee (All: 14% · M: 9% · F: 19%) | Shopee (All: 11% · M: 12% · F: 11%) | Adayroi.com (All: 15% · M: 14% · F: 16%) | Thế Giới Di Động (All: 19% · M: 16% · F: 21%) |
| No. 3 | Sendo (All: 9% · M: 9% · F: 10%) | Tiki.vn (All: 6% · M: 6% · F: 7%) | Shopee (All: 8% · M: 5% · F: 10%) | FPT Shop (All: 8% · M: 7% · F: 9%) |
| No. 4 | Tiki.vn (All: 9% · M: 8% · F: 10%) | Adayroi.com (All: 5% · M: 6% · F: 5%) | Tiki.vn (All: 5% · M: 4% · F: 6%) | Adayroi.com (All: 7% · M: 7% · F: 8%) |
The Q&Me category matrix on slide 11 reveals distinct positioning across platforms:
- Lazada ranks No. 1 across all four verticals: Recorded its highest recall in Fashion (52%) and IT / Electronics (38%), with consistently higher recall among male respondents than females across every category (such as 59% male vs. 47% female in Fashion).
- Shopee captures strong female recall in Fashion (19%): Ranked No. 2 in both Fashion (14% overall; 19% female vs. 9% male) and Beauty Care (11%), and placed No. 3 in Food (8% overall; 10% female).
- Specialized strengths of Adayroi, Thế Giới Di Động, FPT Shop, Sendo, and Tiki: Vingroup's Adayroi.com captured No. 2 in Food (15%) and placed #4 in both Beauty Care (5%) and IT / Electronics (7%). In IT / Electronics, omnichannel handset retailers Thế Giới Di Động (19%) and FPT Shop (8%) claimed No. 2 and No. 3, outperforming general marketplaces. Meanwhile, Tiki.vn ranked in the Top 4 across three categories (Fashion 9%, Beauty Care 6%, Food 5%), and Sendo held No. 3 in Fashion (9%).
Why Did Cash on Delivery (88%) Dominate Mobile Payments and What Should Businesses Do Next?
Chapter 4 (slides 12–13, Mobile Payment) analyzes e-commerce payment preferences in Vietnam and outlines Appota's 30-million-user platform ecosystem.
Cash on Delivery Accounts for 88% of E-Commerce Orders While E-Wallets Stand at 1%
On slide 12 (Payment methods, source: Q&Me), the donut chart shows that cash settlement remained the overwhelming default for online shoppers in Q3 2017:
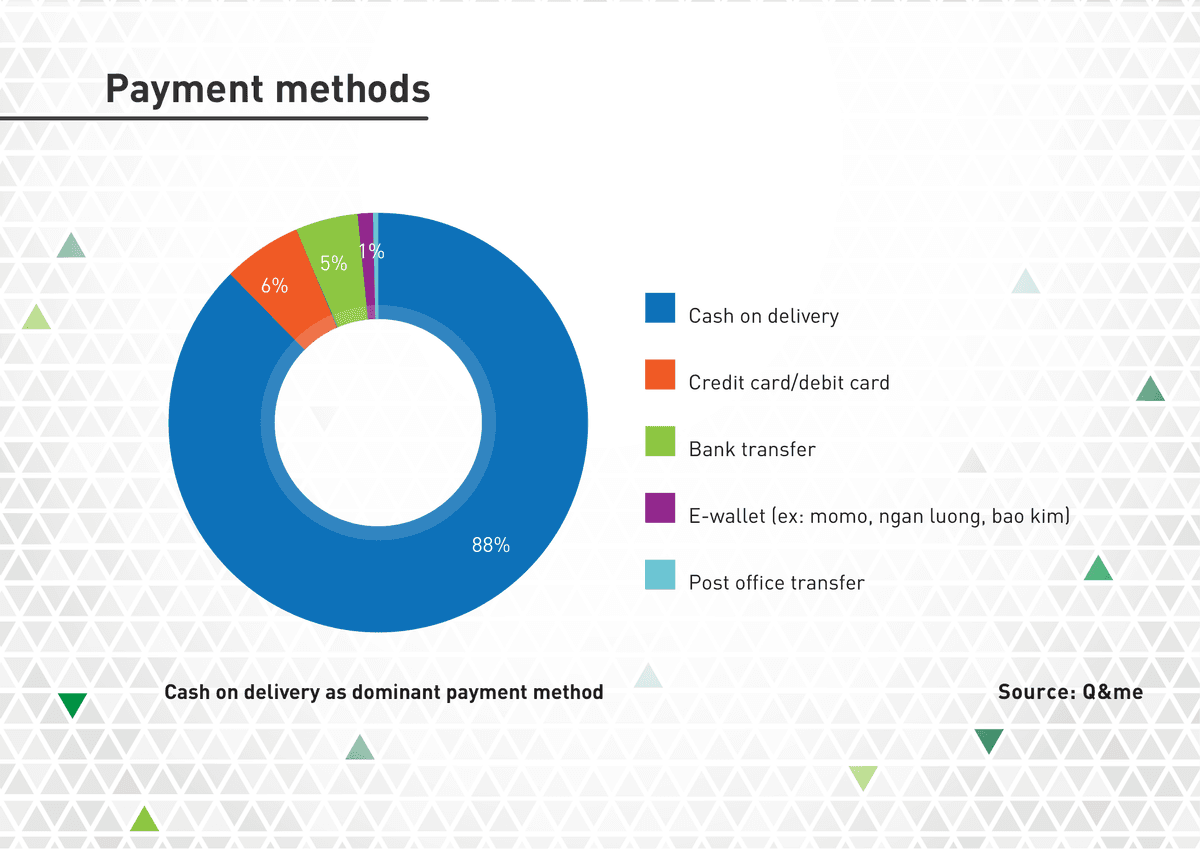
- Cash on delivery (COD): Accounted for 88% of all e-commerce transactions.
- Credit card / debit card: Ranked second at 6%.
- Bank transfer: Represented 5% of transactions.
- E-wallet (e.g., MoMo, Ngân Lượng, Bảo Kim): Accounted for 1% of online shopping payments.
- Post office transfer: Plotted as a thin cyan sliver on the chart (<1% after rounding).
| E-Commerce Payment Method (Slide 12 — Q&Me) | Transaction Share | Operational Impact for Merchants in Vietnam |
|---|---|---|
| Cash on delivery (COD) | 88% | Addresses consumer trust concerns but increases return rates and cash-collection settlement delays |
| Credit card / Debit card | 6% | Concentrated among urban professionals purchasing electronics, travel, and cross-border goods |
| Bank transfer | 5% | Used for high-ticket orders and direct social-commerce transactions |
| E-wallet (MoMo, Ngân Lượng, Bảo Kim) | 1% | High growth potential when bundled with cashback promotions, game top-ups, and bill payments |
| Post office transfer | <1% (thin sliver) | Serves rural and provincial buyers without convenient bank branch access |
On slide 13, the report summarizes Appota's position across three core segments driving Vietnam's mobile economy: Game Publishing, Advertisement, and Payment. By Q3 2017, Appota served more than 30 million users and partnered with over 15,000 developers, advertisers, and merchants worldwide through its three subsidiary companies: Gamota (gamota.com), Adsota (adsota.com), and AppotaPay (appotapay.com).
Four Actionable Recommendations for Game Studios, Brands, and E-Commerce Merchants
Drawing on the Q3 2017 data from Appota, GfK, and Q&Me, product and growth leaders operating in Vietnam can execute four high-priority initiatives:
- Optimize App Binaries for Mid-Range Samsung and Oppo Android Handsets: Because 67% of users run Android on an average 6.2 Mbps connection and entry/mid-range models (Samsung Galaxy J2 Prime, J5 Prime, J7 Prime, J7 Pro and Oppo A37, F3) account for 70% of retail best-sellers, engineering teams running a mobile game soft launch checklist should benchmark frame rates and installer sizes specifically on these devices.
- Build 30-Day Retention Loops to Counter the 58% Monthly Game Uninstall Rate: With users opening only 8 of 33 installed apps daily and 58% uninstalling games each month (while Top 5 free download volumes dipped 1% to 33% QoQ), domestic publishers—who currently capture just 26.22% of local game installs—should shift from short-lived casual titles toward social and competitive genres like eSports (Honour of Kings up +53% in revenue) and strategy (Lords Mobile up +23%).
- Target Mobile App Campaigns at Female Shoppers (64%) Aged 18–30 in HCMC and Hanoi Ahead of Q4: Now that smartphone browsers and shopping apps have overtaken desktop PCs (exemplified by Shopee reaching 10 million app installs and a 33% share), Fashion and Beauty brands should prioritize in-app campaigns tailored to female consumers (64%) aged 18–30 (64%) in HCMC and Hanoi (55%), timing promotional spend for the Q4 holiday peak after Q3's Ghost Month slowdown.
- Streamline COD Reconciliation (88%) While Incentivizing Digital Pre-Payment: Because 88% of orders rely on cash on delivery while cards (6%), bank transfers (5%), and e-wallets (1%) represent a combined 12%, merchants should tighten logistics reconciliation and reduce checkout friction using a structured payment gateway integration checklist.
Sources
- Vietnam Mobile Report Q3-17 (Vietnam Mobile Report Quarter 3 2017), Công ty Cổ phần Appota (Appota Group), 2017-12-07, accessed 2026-11-02
- Smartphone Sales 3Q 2017 vs. 3Q 2016: Global & Emerging Asia Point of Sales Tracking, GfK, 2017-11-15, accessed 2026-11-02
- Bảng xếp hạng 10 dòng điện thoại bán chạy nhất quý 3/2017 tại FPT Shop và Thế Giới Di Động, FPT Shop & Thế Giới Di Động (tổng hợp bởi Appota), 2017-10-15, accessed 2026-11-02
- Popular Online Shops by Category & E-Commerce Payment Methods in Vietnam (2017), Q&Me Vietnam Market Research, 2017-10-20, accessed 2026-11-02
- Hệ thống đo lường thiết bị, ứng dụng, game di động và thương mại điện tử của Appota (Quý 3/2017), Công ty Cổ phần Appota (Appota, Gamota, Adsota, AppotaPay), 2017-12-07, accessed 2026-11-02