
State of Mobile Apps in Vietnam Q2 2015 Report
Appota's Q2 2015 report on mobile apps in Vietnam analyzes telemetry from 17.5 million domestic users alongside global OS benchmarks. Vietnam recorded 33 million smartphone users, 79% Wi-Fi data traffic, over 200 million downloads across 10,000 local apps, 30 million Zalo users, and the upcoming launch of the Adsota ad network.
Analysis of 33M smartphone users, 79% Wi-Fi traffic, 200M+ downloads across mobile apps in Vietnam during Q2 2015, iOS 8 (39%) and KitKat share, Zalo's 30M users, and Adsota.
Key findings
- 78% Android & 81% iOS 8Android led the global smartphone OS market in Q1 2015 with a 78% share, while iOS held 18.3% and Windows Phone edged up YoY from 2.5% to 2.7% (IDC); by April–May 2015, iOS 8 reached 81% global adoption compared with 9.7% for Android 5.0/5.1 Lollipop and 39.8% for KitKat (Apple, Google).
- 30M Zalo users & 1,500+ MGAIn Vietnam's OTT messaging market, Zalo took the lead with 30 million users and began in-app ad monetization ahead of runner-up Viber (23 million users, which closed its Vietnam office to consolidate in the Philippines); meanwhile, Mobile Game Asia 2015 debuted in Vietnam with 1,500+ participants and 200+ companies across Asia (VNG, Viber, Appota).
- 33M smartphones & 61% AndroidVietnam recorded 51.4 million active 3G accounts, 38 million mobile internet users, and 33 million smartphone users (Mobile Game Asia 2015); across a 22-million-user sample on Facebook Ads, Android accounted for 61% (13.5 million users), iOS held 31% (6.9 million), and Windows Phone represented 8% (Facebook Ads).
- 79% Wi-Fi & 17.3 MbpsWi-Fi carried 79% of total mobile data traffic in Vietnam (primarily from homes, offices, and internet cafes) at an average speed of 17.3 Mbps and $10/month for unlimited data, whereas 3G accounted for 21% of traffic at a 1.9 Mbps average speed and $3–$5 per 1 GB of data (GfK, Tech in Asia, Appota).
- 12% iPhone 6 & 39% iOS 8In Vietnam during Q2 2015, iPhone 6 and 6+ expanded to 12% of total iPhone users, pulling the leading iPhone 4 cohort down noticeably (to roughly 36%, ahead of iPhone 5 at ~30%); by OS version, iOS 8 reached 29% on iPhone and 10% on iPad, representing 39% of active iOS devices (Appota).
- >50% KitKat & 32% SamsungMore than half of Android users in Vietnam ran Android 4.4 KitKat in Q2 2015 while Lollipop adoption progressed much more slowly than iOS 8; Samsung led hardware vendors with 32% of Android phone and tablet users (exceeding the next five brands combined), while Asus (10%) and Oppo spearheaded the $150–$250 budget segment capable of running 3D mobile games (Appota).
- 200M+ downloads & 10,000 appsBy Q2 2015, Vietnam reached 10,000 local apps and games and surpassed 200 million downloads on Appota's platform, with the quarterly download index hitting 140% (up 8 percentage points from 132% in Q1 2015 and up 40% over Q1 2014); 8 of the Top 10 apps ranked simultaneously on both the iOS and Android leaderboards (Appota).
- 17.5M users & Adsota launchAppota's user base in Vietnam expanded to 17.5 million users in Q2 2015 as the company prepared to launch the Adsota mobile ad network, published two titles (Top 12 and Ai My Nhan Mobile) into the Thailand market, and earned YouTube's Silver Play Button for its mobile game review channel (Appota).
How Did Global OS Trends Shape Mobile Apps in Vietnam in Q2 2015?
Released on July 15, 2015 by Appota Joint Stock Company, the Q2 2015 report on mobile apps in Vietnam (State of mobile apps Q2/2015) provides quarterly operational benchmarks for developers and game publishers. The 23-slide study combines telemetry from Appota's distribution platform (reaching 17.5 million users in Vietnam, up from 13 million in Q1 2015) with datasets from IDC, Apple, Google, VNG, Viber, Mobile Game Asia 2015, Facebook Ads, GfK, and Tech in Asia.
Readers following our Gaming coverage can compare these findings with the State of Mobile Apps in Vietnam Q1 2015 Report to track sequential shifts. Chapter 1 (slides 4–6) reviews three-year global operating system share trends and contrasts version upgrade velocity between Apple's iOS 8 and Google's Android Lollipop.
Android Holds 78% Global OS Share While iOS Reaches 18.3% and Windows Phone Edges Up to 2.7%
According to IDC Smartphone OS Market Share, Q1/2015 data cited on slide 4, global smartphone OS distribution from Q1 2012 through Q1 2015 remained led by Android and iOS:
- Android leads with a 78% share: Android's global share rose from roughly 59% in Q1 2012 to ~75% in Q1 2013 and ~81% in Q1 2014 before adjusting to 78% in Q1 2015.
- iOS holds an 18.3% share: While down slightly from the Q4 2014 holiday peak and below its ~23% mark in Q1 2012, Q1 2015 iOS share (18.3%) stood above its Q1 2013 (~17%) and Q1 2014 (~15.2%) levels.
- Windows Phone rebounds slightly to 2.7%: Windows Phone edged up YoY from 2.5% to 2.7%, leaving open whether Microsoft could expand its ecosystem with Windows 10. All other platforms (Others) fell from ~9.5% in Q1 2012 to 1.0% in Q1 2015.
| Operating System / Version | Q1 2012 | Q1 2013 | Q1 2014 | Q1 2015 (Apr–May 2015) | Slide Source |
|---|---|---|---|---|---|
| Android (Global OS share) | ~59.0% | ~75.0% | ~81.0% | 78.0% | IDC (slide 4) |
| iOS (Global OS share) | ~23.0% | ~17.0% | ~15.2% | 18.3% | IDC (slide 4) |
| Windows Phone (Global OS share) | ~2.0% | ~3.2% | 2.5% | 2.7% (+0.2 pp YoY) | IDC (slide 4) |
| Others (Global OS share) | ~9.5% | ~1.5% | ~1.2% | 1.0% | IDC (slide 4) |
| Global iOS version split | — | — | — | iOS 8: 81% · iOS 7: 17% · Earlier: 2% | Apple, Apr 27, 2015 (slide 5) |
| Global Android version split | — | — | — | KitKat: 39.8% · JB (labeled ICS): 39.2% · Lollipop: 9.7% · Earlier: 6.0% | Google, May 2015 (slide 6) |
Global Upgrade Contrast: iOS 8 Reaches 81% Adoption While Android Lollipop Stands at 9.7%
Slides 5 and 6 contrast global OS version adoption across Apple and Google in April and May 2015:
- iOS 8 reaches 81% of eligible devices (slide 5): Per Apple's App Store visitation stats on April 27, 2015, 81% of eligible iOS devices ran iOS 8 (up 2 percentage points from Apple's prior release), with iOS 7 at 17% and Earlier versions at 2%. Growth was supported by iOS 8.3, the Apple Watch, and developer testing of iOS 8.4 with its redesigned Music app.
- Android KitKat (39.8%) and Jelly Bean (39.2%) dominate as Lollipop hits 9.7% (slide 6): Per Google's May 2015 stats, Android's top two builds remained KitKat (39.8%) and Jelly Bean (note: the slide 6 chart mislabels the 39.2% Jelly Bean slice as
ICS 39.2%, alongsideKitkat 39.8%,Lollipop 9.7%, andEarlier 6.0%). Released two months after iOS 8, Lollipop initially reached 5.4% of devices before Android 5.0 and 5.1 combined reached 9.7% in May 2015.
Which Five Industry Developments Reshaped Vietnam's Mobile Market in Q2 2015?
Chapter 2 (Vietnam mobile news, slides 7–11) covers five milestones across carrier app stores, domestic smartphones, OTT messaging, game exports, and regional conferences.
Vinaphone and Opera Launch AppMarket While VTV3 Co-Hosts the Bluebird Award
Slide 7 highlights two initiatives supporting app monetization and local developers:
- Vinaphone–Opera AppMarket subscription store: Carrier Vinaphone partnered with Opera to launch AppMarket, offering roughly 300,000 apps and games for a flat subscription of VND 15,000 ($0.70) per week.
- Bluebird Award game competition: Organized by BlueBird and national television channel VTV3 (
http://bbg.vtv.vn), Vietnam's first televised mobile game competition accepted entries until August 19, 2015. Slide visuals feature 1+1=2 Freaking Math (Bang Nguyen, 2014), Angry Birds Fight!, and Monument Valley.
BKAV Unveils the Bphone Smartphone as Q-Mobile Rebrands to "Q"
On the hardware front (slide 8), domestic brands challenged international vendors in Q2 2015:
- BKAV introduces Bphone: Technology group BKAV unveiled Bphone (displaying a May 26, 2015 lock-screen date), Vietnam's first domestically designed flagship smartphone.
- Q-mobile rebrands to "Q": Local handset brand Q-mobile shortened its name to a single letter "Q" to compete directly against Bphone.
Vietnam's OTT Battleground: Zalo Hits 30 Million Users as Viber Closes Its Vietnam Office
On slide 9, data from VNG and Viber shows a decisive shift in Vietnam's OTT messaging market:
- Zalo leads with 30 million users: Local messaging app Zalo reached 30 million users and began monetizing through in-app advertising.
- Viber (23 million users) consolidates in the Philippines: Runner-up Viber recorded 23 million users and closed its Vietnam office, moving operations to its Southeast Asian office in the Philippines.
- Viettel and Vinaphone launch Mocha and Viettalk: Leading carriers Viettel and Vinaphone launched rival messaging apps Mocha and Viettalk, competing alongside BeeTalk and LINE.
| Q2 2015 Market Milestone | Companies / Products | Reported Scale | Strategic Significance (Slide) |
|---|---|---|---|
| Telco store & Game contest | Vinaphone–Opera AppMarket / Bluebird Award | ~300,000 apps at VND 15,000 ($0.70)/week; until Aug 19, 2015 | Weekly carrier billing and national indie contest (slide 7) |
| Domestic smartphone brands | BKAV Bphone / Rebranded "Q" (Q-mobile) | Unveiled May 2015 | Local brands enter mid-to-high-tier hardware (slide 8) |
| OTT messaging consolidation | Zalo (VNG) / Viber / Mocha & Viettalk | Zalo: 30M users · Viber: 23M users | Zalo starts in-app ads; Viber exits local office (slide 9) |
| Viral casual & Game exports | Pirate Kings / Divmob (Epic Heroes War) | Divmob hits 40M downloads; launches on Kakao | Proves simple casual mechanics and game exports (slide 10) |
| Mobile Game Asia 2015 | Regional conference debut in Vietnam | 1,500+ attendees, 200+ Asian firms, 70+ speakers, 20+ topics | Foreign investor interest and licensing focus (slide 11) |
Pirate Kings Goes Viral, Divmob Reaches 40 Million Downloads, and Mobile Game Asia Debuts
Slides 10 and 11 highlight the momentum of Vietnam's game studios and regional integration:
- The Pirate Kings craze (slide 10): A year after Flappy Bird, Pirate Kings swept Vietnam with simple one-button mechanics that proved effective at retaining players.
- Divmob launches on Kakao and hits 40 million downloads (slide 10): Epic Heroes War by Divmob became the first Vietnamese online game distributed on Kakao, while Divmob surpassed 40 million total downloads across all its titles.
- Mobile Game Asia 2015 debuts in Vietnam (slide 11): Bringing together 1,500+ participants, 200+ Asian companies, 70+ speakers, and 20+ topics, the event highlighted two
#2015TRENDshifts: local studios exporting games abroad, and foreign publishers entering Vietnam while closely tracking regulations for mobile game publishing in Vietnam.
How Did 3G, Wi-Fi, and 33 Million Smartphone Users Shape Mobile Apps in Vietnam?
Opening Chapter 3 (Mobile apps in Vietnam, slides 12–21), slides 12 and 13 quantify Vietnam's mobile internet scale, OS distribution, and Wi-Fi versus 3G connectivity.
33 Million Smartphone Users, 51.4 Million Active 3G Accounts, and a 61% Android Share
On slide 12 (State of smartphone in Vietnam), Mobile Game Asia 2015 figures establish three national connectivity benchmarks:
- 51,400,000 active 3G accounts.
- 38,000,000 mobile internet users.
- 33,000,000 smartphone users.
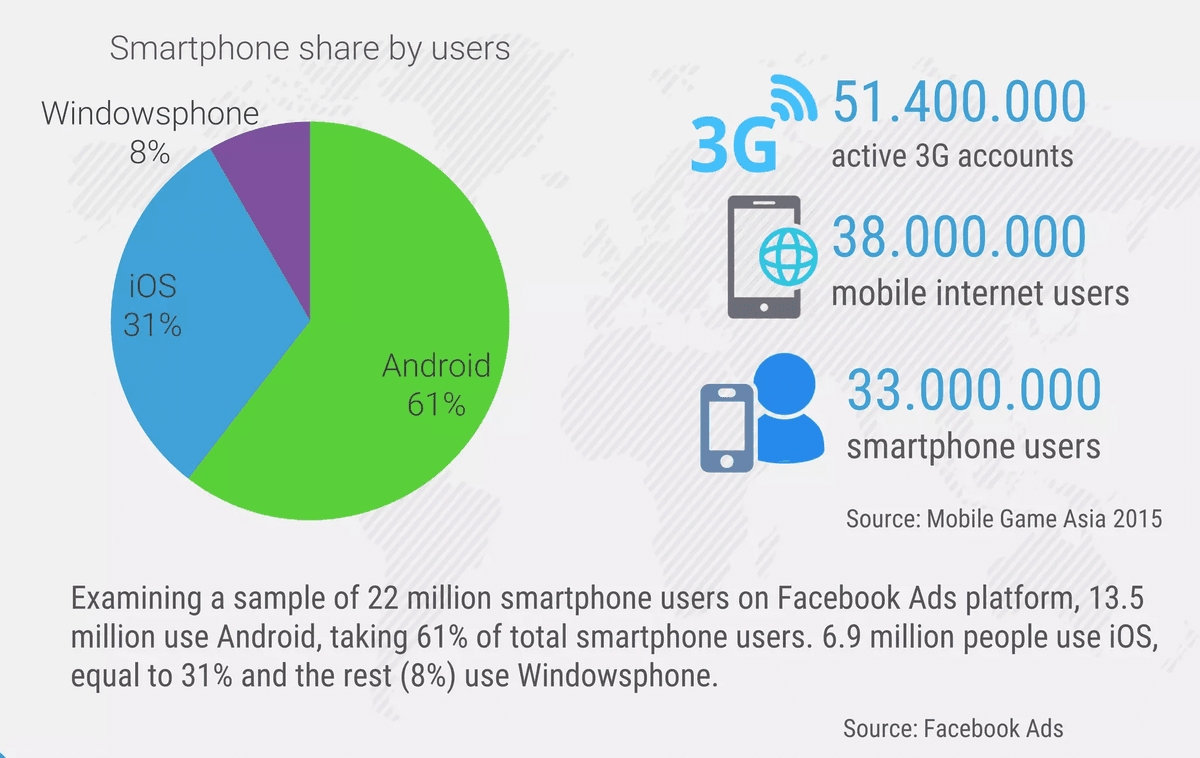
Across a sample of 22 million smartphone users on Facebook Ads (slide 12), active smartphone users split as follows:
- Android captures 61%: Representing 13.5 million users (61.36%).
- iOS holds 31%: Representing 6.9 million users (31.36%).
- Windows Phone accounts for 8%: Representing the remaining ~1.6 million users (7.27%, rounded to 8%).
Wi-Fi Carries 79% of Mobile Data Traffic at 17.3 Mbps Versus 21% on 3G at 1.9 Mbps
Slide 13 (State of mobile connection in Vietnam) synthesizes data from GfK, Tech in Asia, and Appota's platform to compare Wi-Fi and 3G usage:
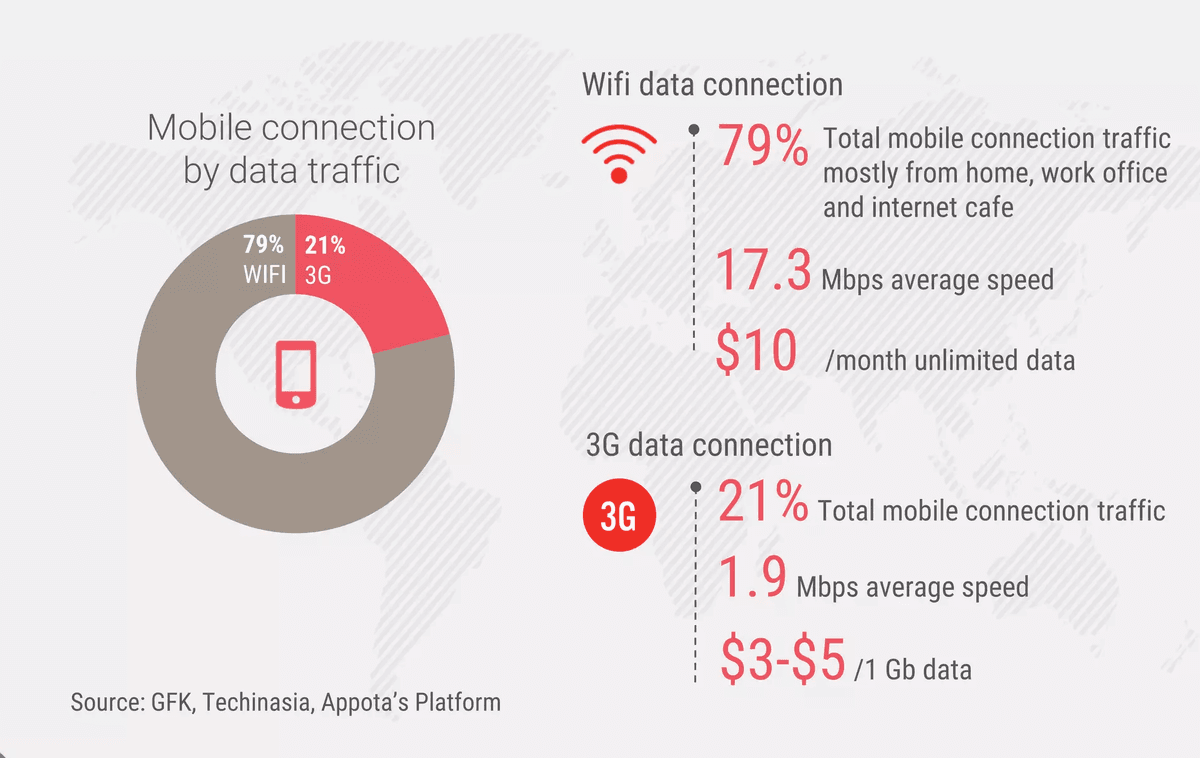
- Wi-Fi carries 79% of total mobile data traffic: Generated mostly from homes, offices, and internet cafes, Wi-Fi averaged 17.3 Mbps at $10/month for unlimited data.
- 3G carries 21% of total mobile data traffic: Cellular 3G averaged 1.9 Mbps (one-ninth the speed of Wi-Fi) at $3 to $5 per 1 GB of data.
| Connectivity Metric (Slide 13) | Wi-Fi Connection | 3G Cellular Connection | Publishing Implication |
|---|---|---|---|
| Share of mobile data traffic | 79% of total traffic | 21% of total traffic | Users download heavy game builds primarily over Wi-Fi |
| Primary usage locations | Home, work office, internet cafe | On the go / commuting | Midday office breaks and evening home hours drive installs |
| Average connection speed | 17.3 Mbps | 1.9 Mbps | Multiplayer netcode must tolerate 1.9 Mbps 3G speeds |
| Consumer data pricing | $10/month (unlimited data) | $3–$5 per 1 GB of data | Avoid forcing large asset updates over metered 3G |
How Did iOS and Android Hardware and OS Versions Shift in Vietnam in Q2 2015?
Slides 14 through 18 detail Appota's Q2 2015 device and OS telemetry in Vietnam.
iPhone 6 and 6+ Reach 12% of iPhone Users as iPhone 4 Declines and iOS 8 Hits 39%
On slide 14 (iPhone Share by users), the seven-quarter line chart (Q4/2013 to Q2/2015) tracks iPhone 6, iphone 5, and iphone 4:
- iPhone 6 and 6+ reach 12%: Climbing from 0% (Q4 2014) and ~5% (Q1 2015), iPhone 6 and 6+ accounted for 12% of total iPhone users in Q2 2015.
- iPhone 4 drops noticeably to ~36%: While still the most used device, iPhone 4 fell from its 50%–57% plateau (Q4 2013–Q1 2015) to ~36% in Q2 2015 due to iPhone 6 upgrades.
- iPhone 5 ranks second at ~30%: Continuing its steady rise from ~17% (Q4 2013) and ~25% (Q1 2015), iPhone 5 reached ~30% in Q2 2015.
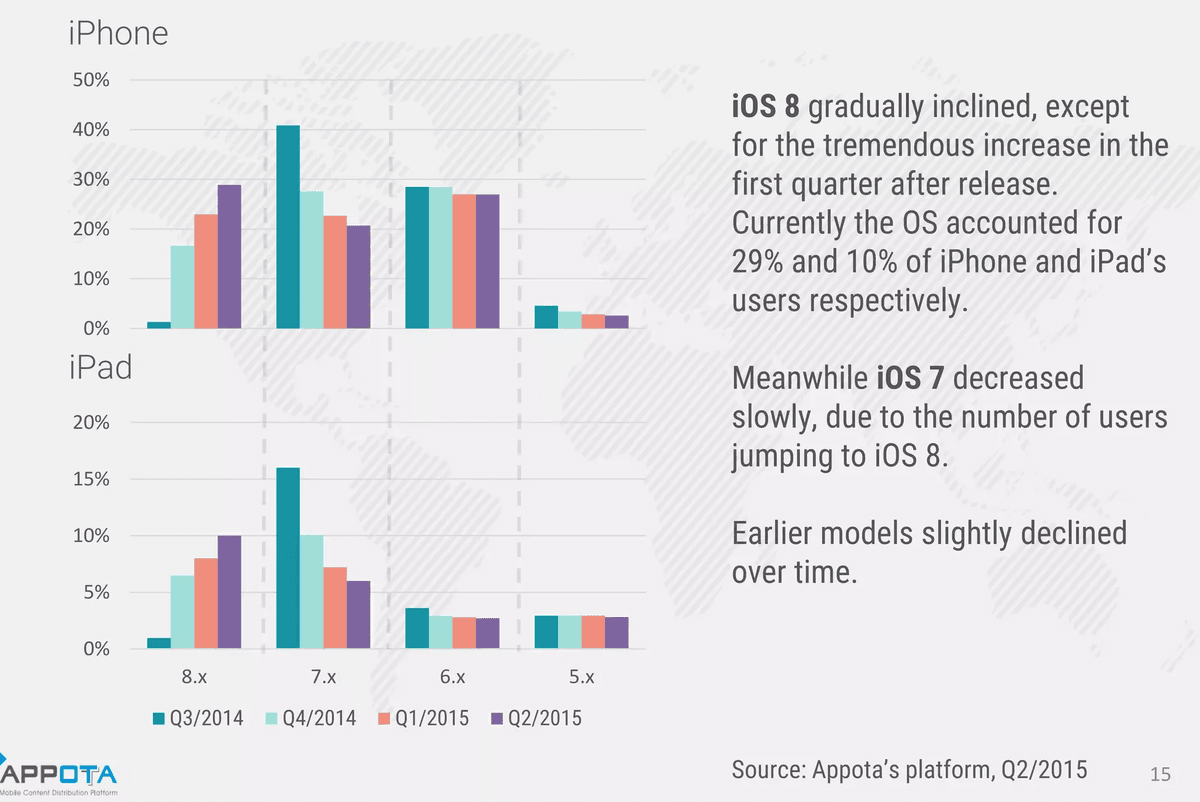
On slide 15, paired bar charts (Q3/2014 to Q2/2015) track iOS versions (8.x, 7.x, 6.x, 5.x) across iPhone and iPad:
- iOS 8 reaches 29% on iPhone and 10% on iPad (39% total):
iOS 8.xclimbed from 23% to 29% on iPhone and from 8% to 10% on iPad in Q2 2015 (up 8 percentage points from 31% in Q1 2015). - iOS 7 declines gradually:
iOS 7.xfell on iPhone from ~41% (Q3 2014) to ~23% (Q1 2015) and ~20.5% (Q2 2015), and on iPad from ~16% to ~7.2% and ~6%. - Legacy iOS 6 and iOS 5 holdouts:
iOS 6.xstayed near ~27% on iPhone and ~2.7% on iPad, whileiOS 5.xheld around ~2.7%–2.8% on each device class.
Android KitKat Exceeds 50% Share, Samsung Reaches 32%, and $150–$250 Phones Fuel 3D Gaming
Across slides 16 to 18, Appota's Q2 2015 Android data highlights three hardware and OS trends:
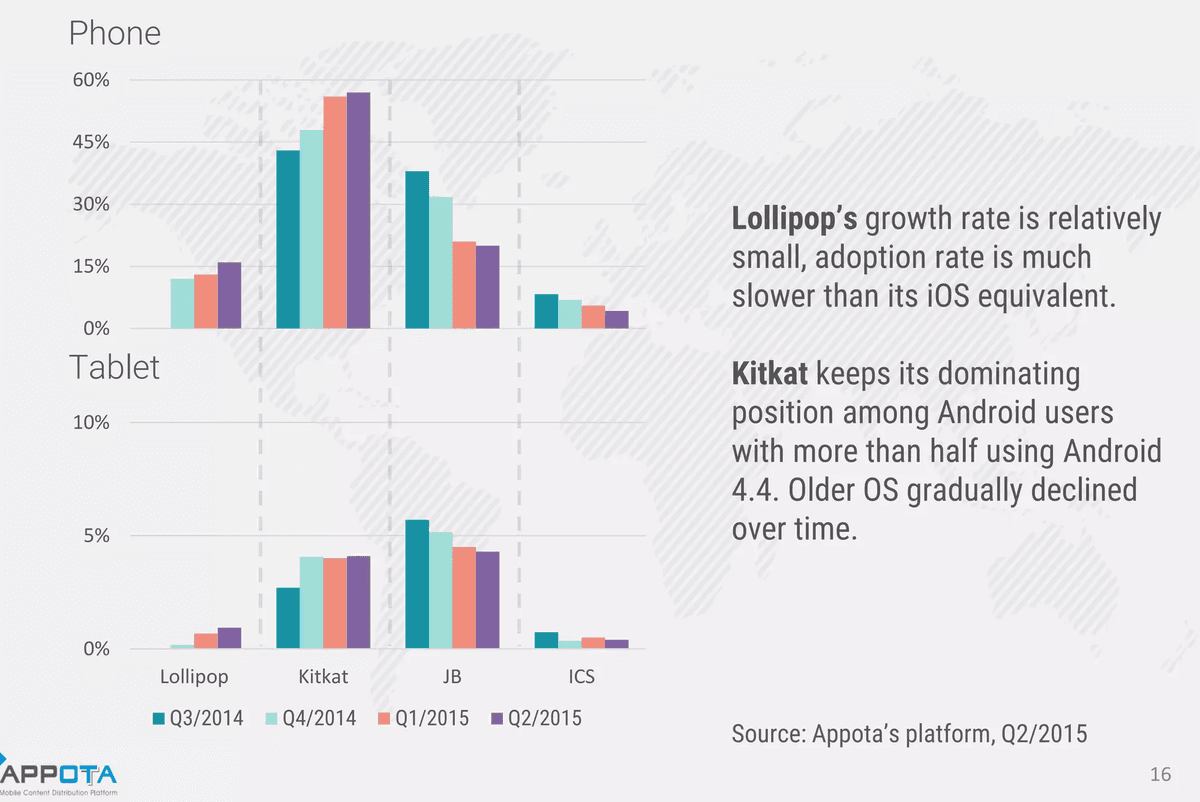
- Android 4.4 KitKat dominates (>50%) while Lollipop grows slowly (slide 16): More than half of Android users ran KitKat (reaching ~57% on Phones and ~4.1% on Tablets). Lollipop grew much more slowly than iOS 8, edging from ~13% to ~16% on Phones and ~0.9% on Tablets. Jelly Bean (JB) declined to ~20% on Phones and ~4.3% on Tablets (still slightly ahead of KitKat on Tablets), while ICS fell to ~4% on Phones and ~0.3% on Tablets.
- $150–$250 budget smartphones from Asus and Oppo support 3D games (slide 17): Asus and Oppo led the $150–$250 budget smartphone segment, meeting minimum specs for 3D mobile games. Slide 17 profiles the Asus Zenfone 5 (April 2014; 145g, 10.3mm; Android 4.3 up to 5.0.2; 8/16/32GB storage; 5.0-inch
720x1280screen; 8MP 1080p camera; 2GB RAM, Intel Atom Z2580 CPU; 2110mAh battery). - Samsung captures 32% of Android users (slide 18): Samsung accounted for 32% of Android tablet and smartphone users (up from 27% smartphone share in Q1 2015), exceeding the next five vendors combined. Asus held 10%, LG 6%, the next eight brands (
Sony,Nokia,Oppo,HTC,Lenovo,Google,Acer,Amazon) 24%, and Other 28%, underscoring the importance of device QA during a mobile game soft launch checklist.
| Vietnam Device Benchmark (Q2 2015) | Model / Version / Vendor | Reported Share / Spec | Operational Takeaway (Slide) |
|---|---|---|---|
| iPhone device families | iPhone 4 / iPhone 5 / iPhone 6 & 6+ | ~36% / ~30% / 12% | iPhone 4 drops sharply as iPhone 6 grows (slide 14) |
| iOS version adoption | iOS 8.x (iPhone + iPad) / iOS 7.x | 29% + 10% (39%) / ~20.5% + ~6% | iOS 8 gains 8 percentage points QoQ (slide 15) |
| Android version adoption | KitKat / Jelly Bean / Lollipop / ICS | >50% (~61% bars) / ~24.3% / ~16.9% / ~4.3% | KitKat dominates phones; Lollipop grows slowly (slide 16) |
| Budget 3D gaming hardware | Asus Zenfone 5 & Oppo $150–$250 tier | 5.0" 720p, 2GB RAM, Atom Z2580, 2110mAh | Budget phones meet 3D mobile game specs (slide 17) |
| Android hardware vendors | Samsung / Asus / LG / 8 mid-tier / Other | 32% / 10% / 6% / 24% / 28% | Samsung exceeds next 5 OEMs combined (slide 18) |
What Do 200 Million+ Downloads and the Top 10 Leaderboards Reveal in Q2 2015?
Slides 19 through 21 report quarterly download growth and the Top 10 Vietnamese apps on iOS and Android on Appota's platform.
Cumulative Downloads Surpass 200 Million Across 10,000 Local Apps as the Quarterly Index Hits 140%
On slide 19 (App downloads), Appota recorded three platform milestones in Q2 2015:
- 200M+ app downloads: Cumulative downloads exceeded 200 million (up from 120M+ in Q1 2015).
- 10,000 Vietnamese apps and games: Local catalog size reached 10,000 titles (+11.1% from 9,000 in Q1 2015).
- 8% growth compared to the previous quarter (
132%to140%index): Benchmarked toQ1/2014 = 100%, quarterly downloads rose from 100% (Q1 2014) to 115% (Q4 2014), 132% (Q1 2015), and 140% in Q2 2015 (+8 index points QoQ, or +6.06% relative QoQ and +40% over Q1 2014).
Eight Titles Rank Simultaneously in the Top 10 Across Both iOS and Android
Slides 20 and 21 list the Top 10 Vietnamese apps on iOS and Android in Q2 2015:
| Order | Top 10 Vietnamese iOS Apps (Slide 20) | Top 10 Vietnamese Android Apps (Slide 21) | Category & Genre Profile |
|---|---|---|---|
| 1 | Hiep Khach - TLBB (Hiệp Khách - Thiên Long Bát Bộ) | I am Naruto | Martial-arts RPG / Manga card battle RPG |
| 2 | Vua bong da (Vua Bóng Đá) | MobiTivi (Mobi TV) | Football management game / Mobile TV streaming |
| 3 | Mobi TV (MobiTivi) | Au Mobile | Mobile TV streaming / Casual rhythm & dance game |
| 4 | Au Mobile | Zing mp3 (Zing MP3) | Casual rhythm & dance game / Online music streaming |
| 5 | The gioi hoan my (Thế Giới Hoàn Mỹ) | NCT (NhacCuaTui) | 3D fantasy MMORPG / Online music streaming |
| 6 | LMHT Mobile | Sieu anh hung (Siêu Anh Hùng) | MOBA strategy RPG / Superhero card battle RPG |
| 7 | NCT (NhacCuaTui) | Hiep Khach – Thien Long Bat Bo | Online music streaming / Martial-arts RPG |
| 8 | I am Naruto | LMHT (LMHT Mobile) | Manga card battle RPG / MOBA strategy RPG |
| 9 | Zing mp3 (Zing MP3) | Tieu su muoi (Tiểu Sư Muội) | Online music streaming / Chibi martial-arts RPG |
| 10 | Naruto dai chien (Naruto Đại Chiến) | The gioi hoan my (Thế Giới Hoàn Mỹ) | Manga tactical RPG / 3D fantasy MMORPG |
Three trends stand out across the Q2 2015 leaderboards:
- Eight titles appear on both charts: Five games (Hiệp Khách - Thiên Long Bát Bộ, Au Mobile, Thế Giới Hoàn Mỹ, LMHT Mobile, I am Naruto) and three media apps (Mobi TV / MobiTivi, NCT, Zing MP3) ranked in the Top 10 on both iOS and Android (up from six cross-platform hits in Q1 2015).
- 3D MMORPG Thế Giới Hoàn Mỹ enters both Top 10s: Powered by iPhone 5/6 and 2GB RAM budget Android phones, Thế Giới Hoàn Mỹ ranked #5 on iOS and #10 on Android.
- Games claim 70% of slots while TV and music streaming take 30%: Alongside MobiTivi and NCT, Zing MP3 joined both Top 10 charts (#9 on iOS, #4 on Android).
How Did Appota's 17.5-Million-User Ecosystem and Adsota Expand in Q2 2015?
Slide 2 and Chapter 4 (Update from Appota, slides 22–23) outline Appota's ecosystem, which reached 17.5 million users in Vietnam across three service pillars (slide 2):
- Distribution & Publishing: Appota Distribution Platform, Appdaily Affiliate Network, and Payota Payment Platform.
- Advertising: GameHub.vn Media News and Adsota Mobile Ads Network.
- Social Network: onClan social network for mobile gamers.
On slide 22, Appota announced three Q2 2015 milestones:
- Upcoming launch of Adsota: A mobile ads network specialized in driving installs and maximizing game/app monetization via diverse ad formats and intelligent targeting algorithms.
- Two game titles released in Thailand: Appota launched Top 12 and Ai My Nhan Mobile (Ải Mỹ Nhân Mobile) in the Thailand market.
- YouTube Silver Play Button award: A mobile game review channel on Appota's distribution network (GameHub.vn) received YouTube's Silver Play Button award as Vietnam's premier mobile game review channel.
Four Actionable Priorities for Mobile App and Game Publishers in Vietnam
From Appota's Q2 2015 telemetry, product and publishing teams can execute four priorities:
- Ship 3D Mid-Core Titles Targeting $150–$250 Android Phones and iPhone 5/6: With Asus/Oppo 2GB RAM phones supporting 3D games and iPhone 5 (~30%) plus iPhone 6/6+ (12%) exceeding 42% of iPhone users, studios can scale 3D titles while maintaining QA on Android 4.4 KitKat (>50%) and Samsung devices (32%).
- Optimize Installers for Wi-Fi (79% Traffic) and Gameplay for 3G (1.9 Mbps): Because 3G costs $3–$5/GB at 1.9 Mbps versus 17.3 Mbps on $10/month unlimited Wi-Fi, apps should route large asset downloads over Wi-Fi and compress live gameplay packets for 3G.
- Pair Zalo In-App Ads (30M Users) and Facebook Ads (22M Sample) With Adsota: User acquisition teams should combine Zalo in-app ads and Facebook Ads (61% Android, 31% iOS) with Adsota, Appdaily, and GameHub.vn video reviews.
- Support Carrier Billing (AppMarket, Payota) and Regional Exports: Weekly carrier subscriptions like VND 15,000/week AppMarket and Payota complement bank cards and e-wallets under a structured payment gateway integration checklist, while top titles can expand into Thailand and South Korea.
Sources
- State of mobile apps in Vietnam Q2 2015 (Vietnam Mobile Report Q2 2015), Công ty Cổ phần Appota (Appota Group), 2015-07-15, accessed 2026-11-02
- IDC Smartphone OS Market Share, Q1/2015 (Global OS Share Trend Q1 2012 – Q1 2015), International Data Corporation (IDC), 2015-05-27, accessed 2026-11-02
- Global iOS 8 Adoption & Android Platform Distribution Stats (April–May 2015), Apple Inc. & Google Inc., 2015-05-04, accessed 2026-11-02
- Vietnam OTT Messaging Market Share (Zalo 30M Users & Viber 23M Users, Q2 2015), VNG Corporation & Viber Media, 2015-07-01, accessed 2026-11-02
- State of Smartphone in Vietnam — Active 3G Accounts, Mobile Internet & OS Breakdown (Q2 2015), Mobile Game Asia 2015 & Facebook Ads, 2015-07-15, accessed 2026-11-02
- State of Mobile Connection in Vietnam — Wi-Fi vs. 3G Data Traffic, Speed & Pricing (Q2 2015), GfK, Tech in Asia & Appota Platform, 2015-07-15, accessed 2026-11-02
- Hệ thống phân phối nội dung di động Appota và mạng lưới Adsota, Payota, Appdaily, GameHub.vn, onClan (Quý 2/2015), Công ty Cổ phần Appota (Appota Group), 2015-07-15, accessed 2026-11-02