
Digital Advertising in Vietnam Report (H1 2018)
The Digital Advertising in Vietnam Report (H1 2018), published by Adsota (an Appota Group company), analyzes demographic shifts, daily Internet habits, and digital media performance. Compiling 16 international and local research sources, the study examines mobile ad spend, display and video benchmarks, social media metrics, and World Cup 2018 campaigns.
Adsota's H1 2018 report on digital advertising in Vietnam covering mobile ad spend, display and video benchmarks, social media usage, and World Cup 2018 campaigns.
Key findings
- 55.3% digital ad spend on mobileAccording to eMarketer (2018) data cited in the report, mobile advertising accounted for 55.3% of total digital ad spending in Vietnam in 2018, rising from 36.6% in 2017 and projected to reach 68% by 2020.
- 215M USD digital ad spend in 2017Vietnam digital ad spending grew from 131.4 million USD (13% of total media ad spending) in 2015 to 215 million USD (18.4%) in 2017, with projections reaching 323.6 million USD (23.6%) by 2020.
- 43% first ad touchpoint is onlineConsumer Barometer (2017) survey data shows that 43% of surveyed consumers in Vietnam encountered their first advertising touchpoint through online channels, ahead of TV (24%) and in-store ads (12%).
- 98% mobile video viewabilityAccording to Statista (2018), Vietnam recorded a 98% mobile video ad viewability rate in 2018, tying with Germany and France (98%) right behind Singapore (99%) among the top four markets worldwide.
- 36% mobile video completion rateMoat (July 2018) benchmarks show Vietnam achieved a 39% video ad completion rate on desktop and 36% on mobile — ranking second in Southeast Asia on mobile devices behind Singapore (45%).
- 59M Facebook audience reachVietnam reached 59 million Facebook users (ranking 7th globally), while Ho Chi Minh City ranked 4th among cities worldwide by Facebook audience size, accounting for roughly 18% of national users.
- 97% World Cup ad audience aged 18–34During the 2018 FIFA World Cup, 91% of targeted digital advertising audiences in Vietnam were male, with ages 25–34 representing 56% and ages 18–24 representing 41% of total reach (Buzzmetrics, Advertising Vietnam).
The first half of 2018 marked a structural inflection point for digital advertising in Vietnam: mobile devices captured more than half of all digital media budgets for the first time (55.3%), while online channels generated 43% of consumers' first advertising touchpoints. Released in September 2018 by Adsota (a creative marketing agency under Appota Group), the Vietnam Digital Advertising Report (H1, 2018) consolidates findings from 16 research organizations to map Vietnam's demographic fundamentals, daily Internet habits, ad format performance, and event-driven marketing during the 2018 football season.
This analysis reconstructs the complete dataset across all 29 slides of the original report, organized into three core areas: Vietnam's digital demographic profile, ad spending and performance across formats, and key market highlights from the first half of 2018. Readers tracking subsequent market developments can compare these figures with the 2019 Vietnam digital advertising market report.
Demographic Fundamentals and Digital Connectivity in H1 2018
Part 01 of the report (Vietnam Digital Profile, slides 3–10) establishes the planning baseline for brands by pairing demographic data from the General Statistics Office of Vietnam (GSO) and Decision Lab (2018) with telecom indicators from We Are Social, Google, Nielsen, and the Vietnam Telecommunications Authority (VNTA) across 2017–2018.
A Working-Age Majority Anchored by Millennials and Generation Z
As of June 2018, Vietnam's population reached 96.5 million, with an urbanization rate of 35%. The national gender distribution remained balanced at 49.5% male and 50.5% female. For media planners and consumer brands, the defining structural indicator is that over 70% of the population belonged to the working-age bracket, providing a broad base of economically active consumers.
By generational cohort, Millennials (born between 1981 and 1996) accounted for 24% of the national population, while Generation Z (born from 1997 onward) represented 15%. Combined, nearly 39% of Vietnamese citizens in mid-2018 belonged to digital-native cohorts whose media consumption and purchasing decisions formed around smartphones and social networks.
Internet Penetration, Mobile Subscriptions, and Web Traffic Split
Built on this young demographic structure, digital connectivity in Vietnam reached two-thirds of the population by H1 2018. Combined figures from We Are Social, Google, Nielsen, and VNTA (2017–2018) show that 67% of the population used the Internet and 57% were active social media users.
| Connectivity & Device Indicator in Vietnam (2017–2018) | Reported Value | Measurement Scope in Report |
|---|---|---|
| Total Population (June 2018) | 96.5 million | 35% urbanization; over 70% working age (GSO, Decision Lab) |
| Internet Users | 67% of population | 94% access the Internet daily (We Are Social, Consumer Barometer) |
| Unique Mobile Users | 73% of population | Smartphone penetration stood at 43% of total population |
| Active Social Media Users | 57% of population | Active mobile social media users reached 52% of population |
| 3G & 4G Subscriptions | 70% | Share of total mobile Internet users |
| Average Internet Connection Speed | 24.7 Mb / 20.3 Mb | 24.7 Mb on fixed connections and 20.3 Mb on mobile connections |
| Web Browser Traffic Share (Desktop / Mobile) | 73% / 24% | Based on share of web pages served to browsers; 3% on other devices |
One technical distinction in the table above requires careful interpretation: desktop computers still generated 73% of web pages served to web browsers, compared with 24% on mobile browsers. Rather than indicating low mobile usage, this gap reflects how Vietnamese smartphone users spent the vast majority of their screen time inside native mobile applications — such as Facebook, YouTube, Zalo, and mobile games — rather than opening mobile web browsers. The rapid expansion of the app ecosystem is examined further in the 2019 Vietnam mobile marketing and game report.
Internet Behavior, Social Platforms, and First Ad Touchpoints
Drawing on survey data from Google's Consumer Barometer (2017) and GlobalWebIndex (2018), Adsota's report highlights a sharp behavioral divide between smartphone and desktop usage among Vietnamese consumers.
Daily Online Frequency and Smartphone Dominance Across Six Activities
According to Consumer Barometer (2017), 94% of Vietnamese Internet users went online every day, 6% connected at least once a week, and 0% reported monthly-only usage. Daily connectivity had become a standard routine across the connected population.
When respondents were asked about their popular online activities by device, smartphones outperformed desktop computers across all six measured categories:
- Watching online video: 79% of surveyed users watched on smartphones, nearly 2.5 times the rate on desktop computers (32%).
- Using social networks: 78% on smartphones versus 32% on desktop.
- Using search engines: 66% on smartphones versus 28% on desktop.
- Playing games: 36% on smartphones versus 12% on desktop.
- Looking for product information: 21% on smartphones versus 9% on desktop.
- Online shopping: 18% on smartphones versus 5% on desktop.
The two highest-indexing smartphone activities — online video (79%) and social networking (78%) — directly explain why mobile video and social feed advertising captured the largest share of incremental budget growth in 2018.
Social Networks, Messaging Apps, and Facebook Audience Dynamics
GlobalWebIndex (2018) survey rankings on slide 7 map the hierarchy of social platforms in Vietnam: Facebook ranked first (touching the 60% axis gridline), followed closely by YouTube (just below 60%). Secondary platforms trailed at a clear distance, led by Instagram (around 39%), Google+ (around 32%), Twitter (around 24%), LinkedIn (around 13%), and Pinterest (around 12%).
In the messaging category (Top Messenger Platforms), the market formed a tight duopoly between Facebook Messenger (ranking first at roughly 47%) and domestic platform Zalo (second at roughly 45%). International competitors occupied smaller niches, including Skype (above 20%), Viber (around 20%), and LINE (around 15%).
Focusing specifically on Facebook (slides 8–9, citing GlobalWebIndex, We Are Social, and Facebook 2018), Vietnam recorded an audience reach of 59 million users, placing the country 7th worldwide. At the municipal level, Ho Chi Minh City ranked 4th among global cities by Facebook reach, accounting for approximately 18% of Vietnam's Facebook user base, followed by Hanoi (around 12%), Da Nang (around 2%), Dong Nai (around 2%), and Can Tho (around 2%).
By gender, Vietnam's Facebook user base comprised 53% men and 47% women. However, 30-day median engagement benchmarks from We Are Social and Facebook (2018) reveal that Vietnamese women interacted more actively than men across every tracked action: clicking on advertisements (Ads clicked — women exceeded 12 clicks per 30 days versus roughly 9 for men), liking posts (Post liked — around 9–10 versus 6), writing comments (Comments — around 7–8 versus 5), and sharing posts (Posts shared — around 2 versus 1). By access device, Android smartphones dominated Facebook connections (exceeding 65%), followed by iPhone devices (over 20%), personal computers (around 5%), mobile web browsers (around 4%), and iPad tablets (under 1%).
Online Channels Lead First Advertising Touchpoints
When evaluating which media channel delivers the initial brand impression (First Touchpoints With Ads, Consumer Barometer 2017 on slide 10), 43% of surveyed consumers in Vietnam encountered their first advertising touchpoint through online channels. That figure was nearly double the share of television (24%) and more than triple that of in-store advertising (12%). Legacy offline channels accounted for single-digit shares: newspapers and magazines stood at 6%, outdoor posters at 6%, email at 2%, direct mail at 1%, and radio at 1%.
Spending and Format Benchmarks in Digital Advertising in Vietnam
Part 02 of the report (Vietnam Digital Insights, slides 11–22) examines budget allocation and technical performance across five core channels: mobile advertising, display advertising, online video, social media advertising, and email/influencer marketing.
Total Digital Ad Spend and the Mobile Inflection Point (2015–2020)
According to eMarketer (2018) data on slide 12, Vietnam digital ad spending grew from 131.4 million USD (13% of total media ad spending) in 2015 to 215 million USD (18.4%) in 2017. eMarketer projected total spend for digital advertising in Vietnam to reach 323.6 million USD by 2020, representing 23.6% of total media advertising expenditure across the country. (Note: the slide 12 prose contains a typographical slip writing "mobile ads spending" for the 2020 figure of 323.6 million USD; matching the slide title and bar chart from 2016 to 2020 confirms this figure represents total digital ad spending).
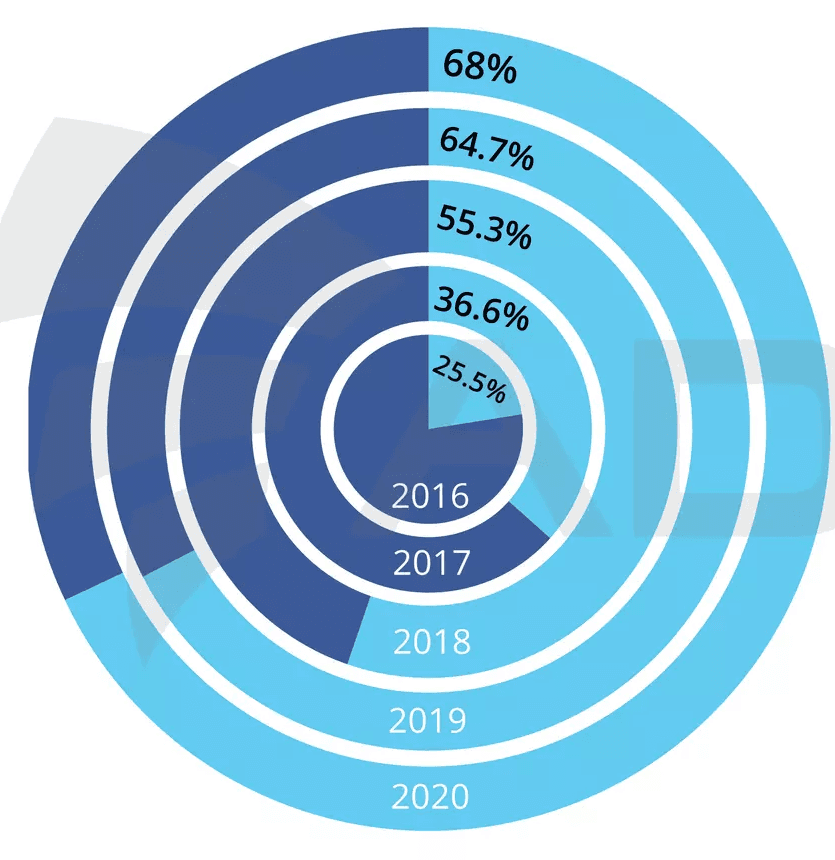
The primary engine behind this expansion was the rapid shift toward mobile devices (excluding MMS and P2P messaging-based ads). As illustrated on slide 13, mobile advertising accounted for 55.3% of total digital ad spending in Vietnam in 2018, crossing the 50% threshold for the first time:
- 2016: 25.5% on the chart ring (the accompanying paragraph writes 22.5%).
- 2017: 36.6% of total digital advertising expenditure.
- 2018: 55.3%, overtaking desktop to become the primary digital ad channel.
- 2019 (forecast): 64.7% of total digital ad spend.
- 2020 (forecast): 68.0% of total digital ad spend.
Display Advertising: Industry Spend Breakdown and Screen Time by Banner Size
Within banner display advertising, Statista (2018) figures on slide 14 demonstrate heavy budget concentration among consumer goods and healthcare advertisers, with the top three verticals generating 60.1% of all display ad expenditure.
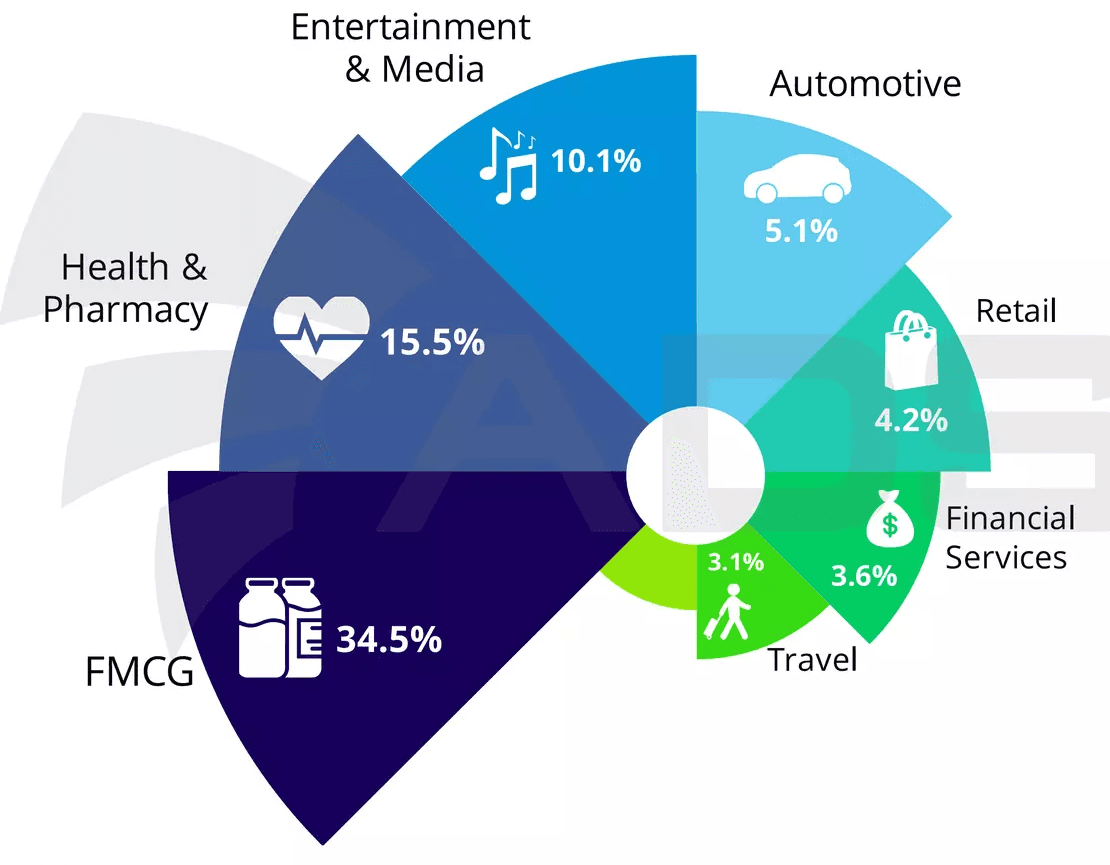
Specifically, FMCG accounted for 34.5% of display ad spending in Vietnam in 2018, followed by Health & Pharmacy at 15.5% and Entertainment & Media at 10.1%. Four additional verticals were broken out individually: Automotive at 5.1%, Retail at 4.2%, Financial Services at 3.6%, and Travel at 3.1%, leaving 23.9% across all other categories.
To evaluate banner effectiveness, slide 15 cites Asia-Pacific measurement benchmarks from Moat (April 2018) tracking Average screen time in seconds across standard ad dimensions:
- On Desktop: Across seven tested formats (
160x600,300x250,300x600,728x90,970x90,970x250, and300x1050), vertical canvas units300x1050and160x600kept user attention longest, both exceeding 30 seconds of average screen time — roughly double the exposure time of horizontal leaderboards such as728x90or970x90(around 15–18 seconds). - On Mobile: Across five tested formats (
160x600,300x250,300x600,320x250, and728x90), the160x600and320x250sizes achieved the longest on-screen duration, both surpassing 20 seconds.
Video Advertising: Vertical Budgets, Completion Rates, and Viewability
Unlike banner display where FMCG dominated, online video ad spending (Statista, December 2017 on slide 16) was led by Retail, which captured 38% of total video budgets. Food & Beverage ranked second at 19%, followed by Health & Fitness at 13% and Finance at 8%. Travel accounted for 5%, while Music & Entertainment and Technology each represented 4% (with the remaining 9% distributed across other industries).
| Industry Vertical (Statista, 2017–2018) | Display Ads Spend Share (2018) | Video Ads Spend Share (Dec 2017) |
|---|---|---|
| FMCG / Food & Beverage | 34.5% (FMCG) | 19.0% (Food & Beverage) |
| Health & Pharmacy / Health & Fitness | 15.5% (Health & Pharmacy) | 13.0% (Health & Fitness) |
| Retail | 4.2% | 38.0% |
| Entertainment & Media / Music & Entertainment | 10.1% (Entertainment & Media) | 4.0% (Music & Entertainment) |
| Financial Services / Finance | 3.6% | 8.0% |
| Automotive | 5.1% | Not listed separately in top group |
| Travel | 3.1% | 5.0% |
| Technology | Not listed separately in top group | 4.0% |
On delivery quality, the report pairs regional completion data from Moat (July 2018) with global viewability rankings from Statista (2018):
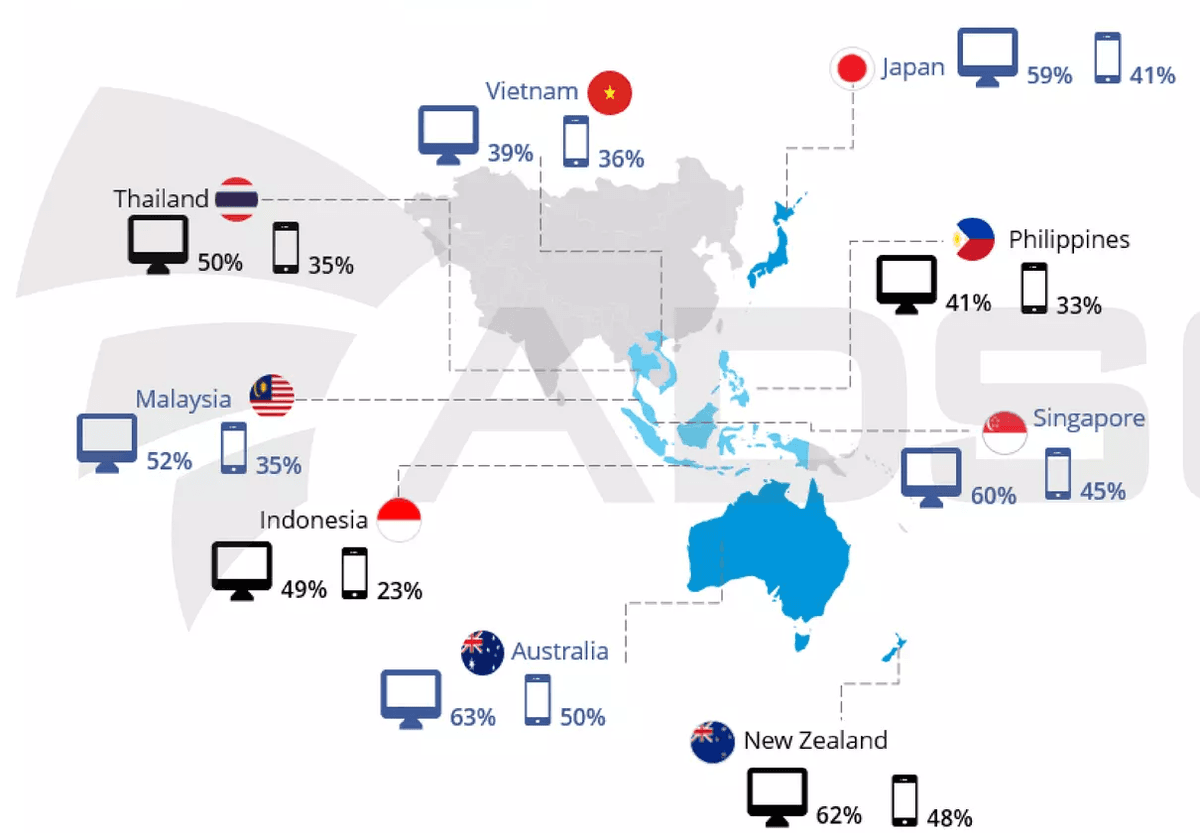
First, across nine Asia-Pacific markets tracked by Moat in July 2018 (Video Ads Completion Rates, slide 17), Vietnam achieved a 39% completion rate on desktop and 36% on mobile. While desktop completion trailed developed APAC markets such as Australia (63% desktop | 50% mobile), New Zealand (62% | 48%), Singapore (60% | 45%), and Japan (59% | 41%), Vietnam's 36% mobile video completion rate ranked second in Southeast Asia, trailing only Singapore (45%) and outperforming Malaysia (52% desktop | 35% mobile), Thailand (50% | 35%), the Philippines (41% | 33%), and Indonesia (49% | 23%).
Second, on Mobile Video Ads Viewability (Statista 2018 on slide 18), Vietnam recorded a 98% mobile video ad viewability rate in 2018, placing the market among the top four countries worldwide alongside Singapore (99%), Germany (98%), and France (98%). Taken together, these two benchmarks show that mobile video inventory in Vietnam delivered near-complete on-screen rendering while maintaining competitive full-view completion rates within Southeast Asia.
Social Media Ad Metrics, Email Open Rates, and Influencer Tiers
For social media advertising performance, slide 19 cites quarterly Asia-Pacific benchmarks from Nanigans (published July 2018, covering Q3 2015 through Q2 2018 across Facebook native desktop, mobile, and Audience Network, excluding Facebook Exchange and Instagram). Over the three-year window, regional click-through rates (CTR) climbed steadily from just over 1% in Q3 2015 to nearly 3% by Q2 2018; cost per thousand impressions (CPM) fluctuated between 3.0 USD and 4.5 USD, while cost per click (CPC) remained consistently below 1.0 USD.
In sharp contrast to sub-dollar Facebook CPCs, slide 20 (Nanigans, July 2018) highlights an unexpected cost outlier: Vietnam recorded the highest Instagram CPC in the world, approaching 4.0 USD on the 0–5.0 USD axis. Completing the top 15 markets with the highest Instagram CPCs in descending order were Kenya, the United States, Nigeria, Jordan, Jamaica, Norway, Qatar, South Korea, Kuwait, Puerto Rico, Cameroon, Austria, Finland, and Canada. Adsota notes that more than half of these 15 countries were developing markets; in Vietnam, inflated Instagram click costs stemmed from unappealing ad creative or misconfigured audience targeting, which depressed click volume and drove up per-click prices.
In Email Marketing, Statista benchmarks from December 2017 (slide 21) show that email open rates across every industry in Vietnam remained below 50%. Education ranked highest at just over 40%, followed by Financial Services and Retail at roughly 35–36%, Agencies at around 32%, Technology & High Tech at around 29%, Arts & Entertainment at around 28%, Travel at around 26%, Health & Beauty at around 21%, and Internet Marketing at the bottom with roughly 16%.
In Influencer Marketing, survey data from Vietnam Economy and the Hiip platform (2018, slide 22) ranks the four primary campaign objectives pursued by brands in Vietnam: (1) Product Launches, (2) Brand Awareness, (3) Content Generation, and (4) Community Building.
Evaluating audience response (Fan Reaction, tracking Engagement Rate, Like Rate, and Share Rate on a 0%–10% scale) across four follower tiers reveals a clear inverse relationship between audience size and engagement rate:
- Micro Influencers (1,000 – 10,000 followers): Generated the highest engagement and like rates on the market at roughly 8%–9%.
- Power Middle Influencers (10,000 – 250,000 followers): Engagement moderated to roughly 2.5%–3%.
- Macro Influencers (250,000 – 1 million followers): Engagement averaged around 1.5%.
- Celebrities (over 1 million followers): Offered broad reach, but engagement rates relative to total follower count fell below 1%.
This early empirical gap between Micro Influencers and mass celebrities laid the foundation for how brands evaluate KOL versus KOC partnerships in Vietnam across the broader marketing and creator economy.
H1 2018 Market Highlights: Data Privacy, Search Trends, and World Cup 2018
Part 03 of the report (Highlights: What to remember about H1, 2018, slides 23–28) examines three defining moments for Vietnamese digital marketers during the first half of 2018, followed by an overview of the national ad tech and media ecosystem.
Fallout from the Cambridge Analytica Data Breach in Vietnam
In early 2018, the disclosure of unauthorized Facebook data harvesting by political consultancy Cambridge Analytica had a direct operational impact on Vietnam's social commerce sector. According to Statista (2018) figures on slide 24, 427,446 Facebook users in Vietnam had their data improperly shared with Cambridge Analytica, placing Vietnam 9th among the 10 most affected countries globally.
| Global Rank | Country (Statista, 2018) | Facebook Users with Improperly Shared Data |
|---|---|---|
| 1 | United States (US) | 70,632,315 |
| 2 | Philippines | 1,175,870 |
| 3 | Indonesia | 1,096,666 |
| 4 | United Kingdom (UK) | 1,079,031 |
| 5 | Mexico | 789,880 |
| 6 | Canada | 622,161 |
| 7 | India | 562,455 |
| 8 | Brazil | 443,117 |
| 9 | Vietnam | 427,446 |
| 10 | Australia | 311,127 |
In response to the privacy crisis, Facebook restricted third-party developer access across its platform APIs. Adsota notes that these API restrictions immediately disrupted thousands of Vietnamese merchants and marketers: Facebook Shop management apps, automated chatbots, and third-party social analytics tools lost access to user profile and messaging endpoints, forcing local businesses to restructure their customer acquisition and CRM workflows.
What Vietnamese Users Searched on Google and YouTube in H1 2018
Google Trends data for H1 2018 (slide 25) captures the two dominant cultural drivers of online attention in Vietnam during the period: international and national football (fueled by Vietnam's U23 national team run in Changzhou and the 2018 FIFA World Cup) and domestic pop music and variety shows:
- Web Search: The top three queries were World Cup 2018 Schedule, youth news portal Kenh 14, and Southern Lottery.
- Image Search: Top visual queries centered on goalkeeper Bui Tien Dung, U23 Vietnam, World Cup 2018, the Vietnamese Flag, fashion house Balenciaga, and footballer Messi.
- YouTube Search: Top video queries featured viral music videos and television game shows: Chay Ngay Di (MV by Son Tung M-TP), Nguoi La Oi (MV by Karik and Orange), Co Gai m52 (MV by HuyR and Tung Viu), Nhanh Nhu Chop (TV Show), Nguoi Am Phu (MV by OSAD), Giai dieu chung doi (TV Show), Bua Yeu (MV by Bich Phuong), U23 Vietnam (Sport), and 7 Nu cuoi xuan (Music Video / TV Show).
Decoding Digital Ad Engagement Around the 2018 FIFA World Cup
The 2018 FIFA World Cup was the marquee commercial event of mid-2018 for brands targeting Vietnamese consumers. Synthesizing data from Buzzmetrics and Advertising Vietnam (2017–2018) on slide 26, the report breaks down audience demographics, creative formats, and pre- and post-match engagement timing.
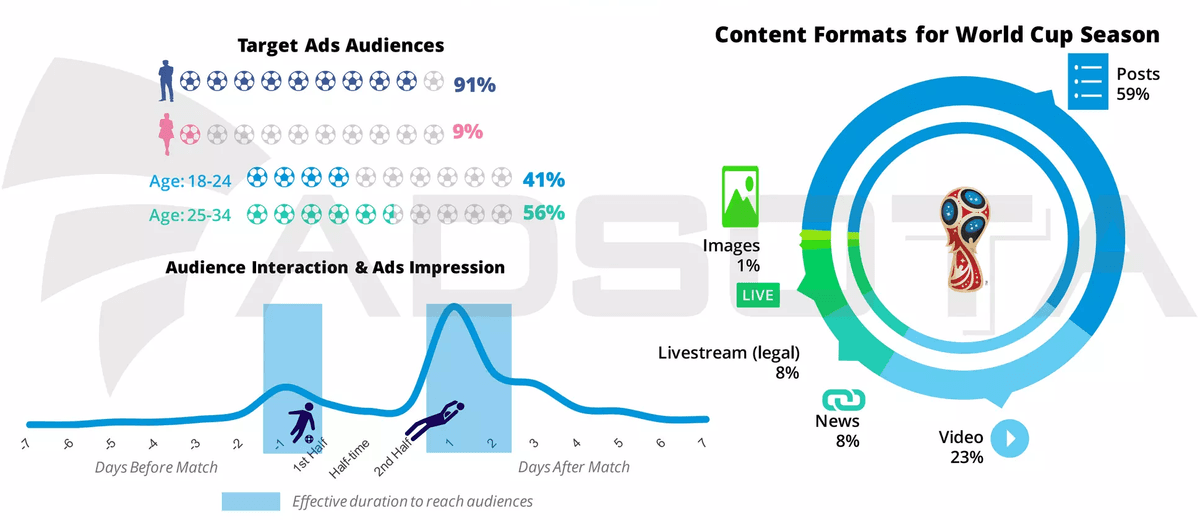
Across World Cup digital advertising campaigns in Vietnam, 91% of targeted audiences were male and only 9% were female. By age bracket, budgets concentrated almost entirely on young adults: the 25–34 age group accounted for 56% and the 18–24 age group accounted for 41%, meaning 97% of targeted viewers fell between 18 and 34 years old.
By content format deployed by advertisers, social Posts made up 59% of campaign assets, followed by Video at 23%, online News articles at 8%, licensed Livestreams at 8%, and static Images at 1%.
Crucially, tracking audience ad interactions across a 15-day window — from 7 days before a match (-7) to 7 days after (+7) — revealed two distinct high-efficiency windows for media pacing:
- Pre-Match to Halftime Window: Audience interaction began climbing 1 day before the match (
-1) and built steadily through Kick-off until the end of the 1st Half. - Second Half to Post-Match Window (Peak Engagement): Engagement accelerated during the 2nd Half, surged past Full-time, and reached its absolute peak on Day +1 after the match, remaining elevated through Day +2 before dropping sharply from Day +3 onward. Post-match score discussions, highlight replays, and fan reactions proved to be the most effective window for brands to capture organic and paid social interactions.
Overview of the Vietnam Digital Advertising Ecosystem in 2018
Closing the presentation (slide 27), Adsota mapped the Vietnam Digital Ads Ecosystem across seven functional categories operating in 2018:
- Facebook Agencies: Adsota, ANTS, Havas Media Group, Isobar, Maxus, MediaCom, and Ureka Media.
- Ad Networks: Adsota, Adtima, Admatic, Admicro, Adways, AdFlex, CleverAds, and Ecomobi.
- Social Listening Platforms: Buzzmetrics, YouNet Media, SMCC, Salesforce Radian6, Social Mention, and Adobe Social.
- Social Platforms: Facebook, YouTube, Instagram, and Zalo.
- Live Streaming Platforms: Facebook, Instagram, YouTube, Bigo Live, 360Live, UpLive, Cube TV, and TalkTV.
- Multi-Channel Networks (MCNs): POPS, Metub, Yeah1 Network, and BigCat.
- eCommerce Platforms: Lazada Group, Shopee, Tiki.vn, Sendo.vn, Adayroi.com, and Hotdeal.vn.
Readers can view the complete 29-slide presentation or download the original PDF report using the links at the top of this page, or explore creative digital marketing services from the publisher at Adsota.
Sources
- Vietnam Digital Advertising Report (H1, 2018), Công ty Cổ phần Adsota (Appota Group), 2018-09-05, accessed 2026-10-31
- Thống kê dân số và cơ cấu thế hệ Việt Nam tháng 6/2018, Tổng cục Thống kê Việt Nam (GSO) & Decision Lab, 2018-06-30, accessed 2026-10-31
- Digital in 2018: Vietnam — Internet, Telecom & Facebook Activity Benchmarks, We Are Social, Nielsen, Cục Viễn thông (VNTA) & Facebook, 2018-01-30, accessed 2026-10-31
- Consumer Barometer Study (Vietnam 2017) & Google Trends Vietnam H1 2018, Google (Consumer Barometer & Google Trends), 2018-07-01, accessed 2026-10-31
- GlobalWebIndex Social Media & Facebook Audience Survey — Vietnam 2018, GlobalWebIndex, 2018-06-01, accessed 2026-10-31
- Vietnam Total Media, Digital & Mobile Ad Spending Forecast (2015–2020), eMarketer (Insider Intelligence), 2018-05-01, accessed 2026-10-31
- Vietnam Display, Video & Email Benchmarks, Mobile Video Viewability & Cambridge Analytica Data Impact, Statista, 2018-06-15, accessed 2026-10-31
- Asia-Pacific Display Ad Screen Time (Apr 2018) & Video Ad Completion Rates (Jul 2018), Moat (Oracle Data Cloud), 2018-07-15, accessed 2026-10-31
- Asia-Pacific Social Media Ad Metrics & Global Instagram CPC Rankings (Jul 2018), Nanigans, 2018-07-20, accessed 2026-10-31
- Vietnam Influencer Marketing Benchmarks & World Cup 2018 Digital Advertising Analysis, Vietnam Economy, Hiip, Buzzmetrics & Advertising Vietnam, 2018-08-01, accessed 2026-10-31