
Vietnam Retail Market Research and 2025 Trend Forecast
AppotaPay's Vietnam Retail Market 2025 report examines consumer demand recovery, distribution channel shifts, and digital payment adoption across Vietnamese retail. Total retail sales and consumer service revenue reached VND 4,148.4 trillion in the first eight months of 2024 (+8.5%), while 55.4% of surveyed merchants operate omnichannel models and e-commerce approaches USD 35 billion by 2025.
An executive analysis of Vietnam's VND 4,148.4 trillion retail market, omnichannel distribution shifts, cashless payment momentum, and 2025 consumer behavior from AppotaPay.
Key findings
- VND 4,148.4TTotal retail sales of goods and consumer service revenue in the first 8 months of 2024, rising 8.5% year-on-year nominally and 5.3% in real price-adjusted terms (National Statistics Office — Ministry of Finance).
- 55.4%Share of surveyed Vietnamese merchants operating omnichannel models combining physical stores and online channels, ahead of store-only (26.6%) and online-only (18%) sellers in Sapo's 15,000-merchant survey.
- VND 143.9TConsumer spending across Vietnam's 5 major e-commerce marketplaces in the first half of 2024, driven by an average of 2.5 million livestream sessions per month from over 50,000 sellers (Metric).
- 9.31B transactionsCashless payment volume in the first 7 months of 2024 (worth VND 160 quadrillion), up 58.4% in volume year-on-year, with QR Code payment volume surging 106.83% (State Bank of Vietnam).
- USD 35BProjected Vietnam e-commerce revenue in 2025 according to the Ministry of Industry and Trade, alongside a projected 7.46% annual retail market growth rate from 2024 to 2028 (Statista).
- 73%Share of Vietnamese consumers expecting a seamless shopping journey across online touchpoints and physical stores according to Accenture's consumer research.
- 80%Share of consumers willing to pay a premium for products committed to clean and sustainable standards according to Nielsen, pushing retail chains to strengthen traceability.
How is the VND 4,148.4 trillion Vietnam retail market structured across channels?
During the first eight months of 2024, the Vietnam retail market reached VND 4,148.4 trillion in total retail sales of goods and consumer service revenue, up 8.5% year-on-year. Figures were released by the National Statistics Office under the Ministry of Finance (then the General Statistics Office). Excluding price inflation, real volume growth stood at 5.3%. Domestic demand recovered steadily, though finance leaders must still factor input cost pressure into margin targets.
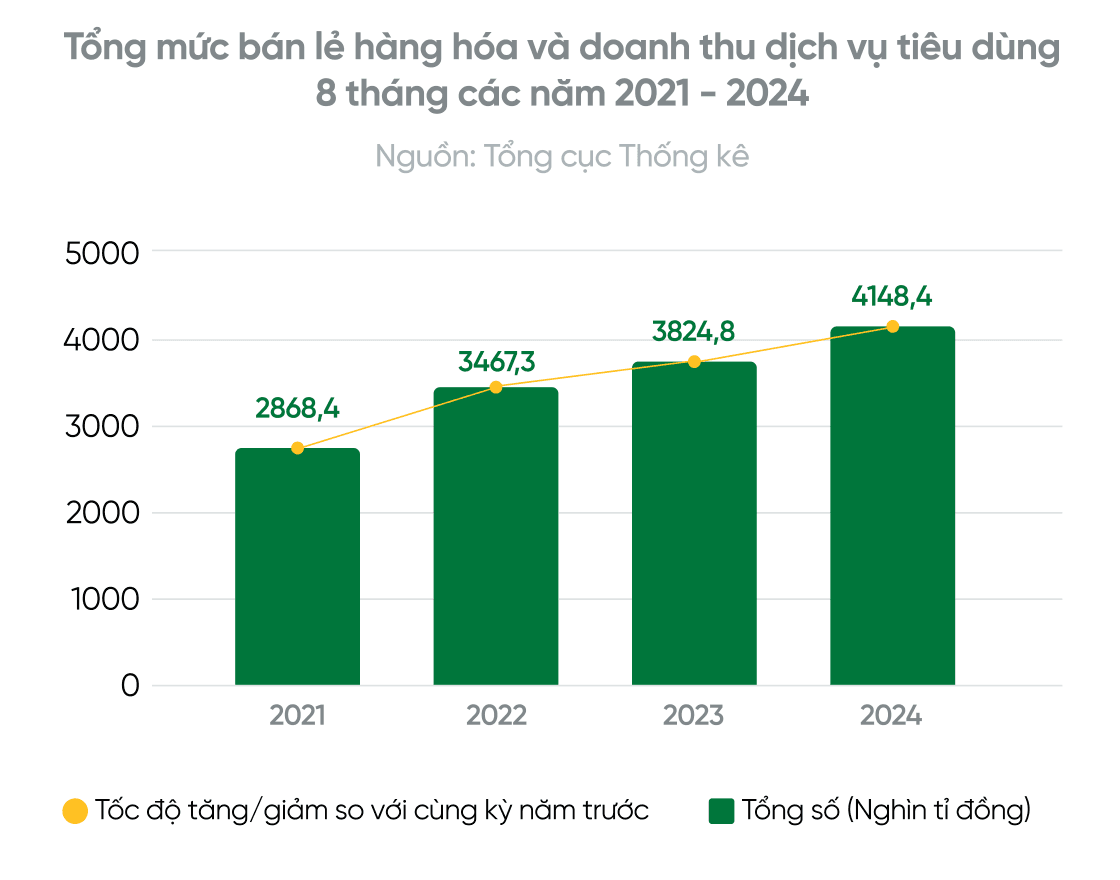
From 2021 to 2024, eight-month domestic consumption climbed every year. Revenue expanded from VND 2,868.4 trillion in 2021 to VND 3,467.3 trillion in 2022 and VND 3,824.8 trillion in 2023. By 2024, cumulative spending reached VND 4,148.4 trillion. Merchandise retail still generates over three-quarters of total spending, while tourism-linked services recorded the fastest rebound:
| Retail & Consumer Service Segment (8M 2024) | Revenue (VND trillion) | Share of Total | YoY Growth vs. 8M 2023 |
|---|---|---|---|
| Retail sales of goods | 3,199.7 | 77.1% | +7.3% |
| Accommodation and food services | 481.2 | 11.6% | +14.3% |
| Travel and tourism services | 40.9 | 1.0% | +26.2% |
| Other consumer services | 426.6 | 10.3% | +9.4% |
| Total retail sales and consumer services | 4,148.4 | 100% | +8.5% |
Within merchandise retail, gemstones and precious metals rose 43.4%, while food and foodstuffs grew 12.6%. Apparel increased 9.7%, passenger cars rose 7.5%, petroleum products grew 7.2%, and household appliances gained 5.9%. By locality, industrial and tourism corridors such as Quang Ninh (+10.6%) and Hai Phong (+9.3%) outpaced or matched Ho Chi Minh City (+9.6%). Other major hubs posted steady gains, including Can Tho (+7.7%), Da Nang (+7.6%), and Hanoi (+6.3%).
Enterprise surveys reflect both recovering demand and persistent cost pressure. In Vietnam Report's September 2024 survey covering the first eight months of 2024, 74.6% of retail enterprises maintained or grew revenue year-on-year (25.4% declined). By contrast, only 66.3% maintained or improved profit margins (33.7% saw lower profits). That eight-point gap reflects rent, freight, and promotional discounting.
Three distinct channel lenses for retail capital allocation
A frequent planning mistake is equating online merchant participation with e-commerce's share of total national spending. AppotaPay contrasts three complementary datasets to clarify channel economics:
- Merchant operating model lens (Sapo, 15,000 merchants). Some 55.4% of surveyed sellers operate omnichannel models combining physical storefronts with online channels. Store-only sellers account for 26.6%, while online-only sellers represent 18%.
- Macroeconomic revenue contribution lens (VECOM EBI 2024). E-commerce accounts for roughly 10% of total retail sales of goods and consumer services, up from 8.5% in 2022. Online merchandise retail represents 8.8% of total goods retail, rising from 7.2% the prior year.
- Physical retail footprint lens (RedSeer Consulting). Roughly 1.4 million traditional grocery shops and over 9,000 wet markets hold 75% market share and serve 85% of everyday needs. Supermarkets and convenience stores hold 20% share (growing 10% annually), while online retail grows 35%–45% annually.
Reading all three datasets together clarifies the commercial reality. Most consumer spending still clears through physical checkouts, yet over half of active merchants rely on digital channels for discovery and repeat orders. Abandoning physical stores—or running outlets disconnected from online buyer data—leaves half the customer journey unserved.
Which macroeconomic forces and digital payment shifts shape retail margins?
Chapter 1 examines four drivers governing purchasing power and unit economics in 2024. These include inflation dynamics, labor income growth, cashless payment infrastructure, and buyer selection criteria.
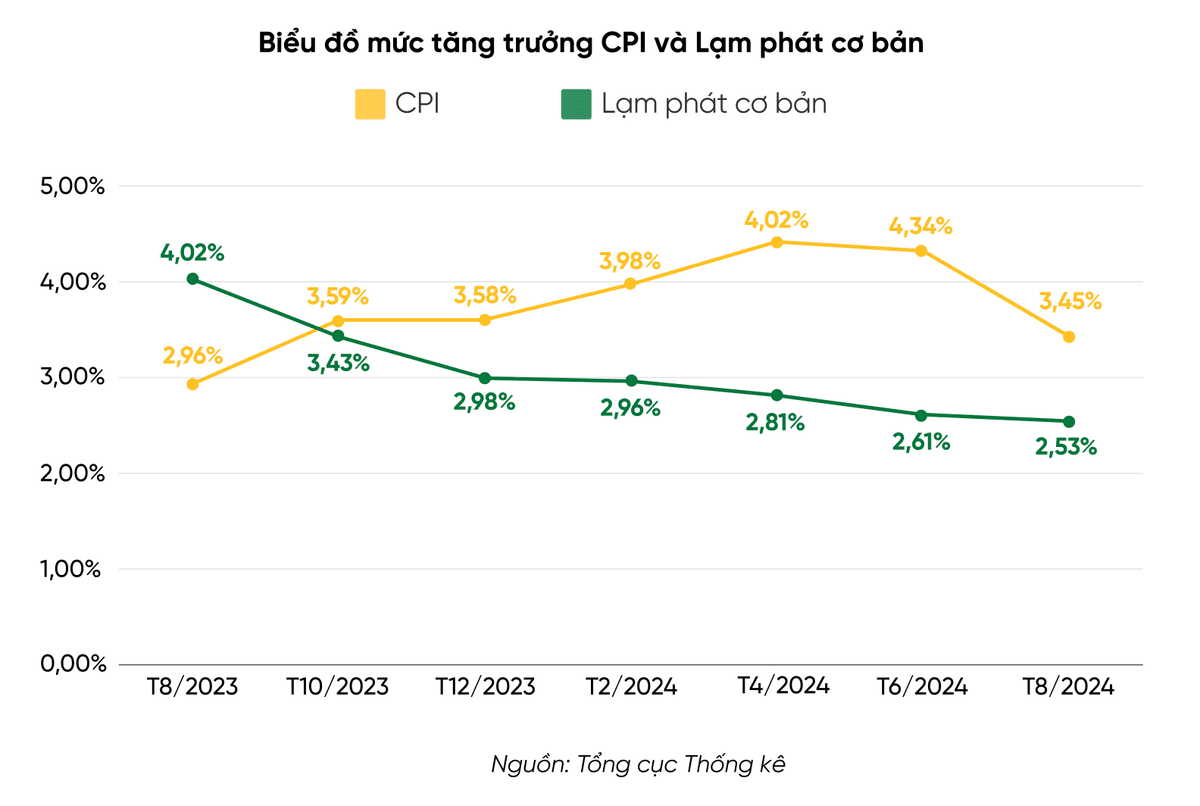
According to the National Statistics Office, headline Consumer Price Index (CPI) growth rose from 2.96% in August 2023 to 4.34% in June 2024. Headline CPI then eased to 3.45% in August 2024, while core inflation fell steadily from 4.02% to 2.53%. Macro stability held firm. However, cumulative increases in raw materials, wages, and freight continue to squeeze independent shops.
On the demand side, Q2 2024 labor statistics recorded average monthly worker income at VND 7.5 million, up 7% year-on-year. Average monthly pay rose steadily from VND 5.5 million in Q2 2020 to VND 7.0 million in Q2 2023. Urban workers averaged VND 9.0 million per month compared with VND 6.5 million in rural areas. That gap explains why premium goods and convenience services cluster first in Hanoi, Ho Chi Minh City, Quang Ninh, and Da Nang.
Cashless checkout acceleration and four buyer selection priorities
The fastest operational shift occurred at checkout. Seven-month 2024 figures from the Payment Department of the State Bank of Vietnam recorded 9.31 billion cashless transactions worth VND 160 quadrillion. Total cashless volume rose 58.4% and value rose 35%, whereas ATM usage contracted:
| Payment Channel (First 7 Months of 2024) | Transaction Volume | YoY Volume Change | Transaction Value | YoY Value Change |
|---|---|---|---|---|
| Mobile phone payments | 6.48 billion | +59.09% | Over VND 41.1 quadrillion | +38.0% |
| Internet payments | 1.72 billion | +49.83% | Over VND 42.0 quadrillion | +33.7% |
| QR Code payments | 151.7 million | +106.83% | Over VND 84.6 trillion | +105.5% |
| ATM network transactions | Contracted YoY | -13.35% | Contracted YoY | -6.13% |
Alongside changing payment habits, consumer brand evaluation in 2024 coalesced around four priorities:
- Ingredient transparency and sustainability. In Coc Coc's Consumer Survey (November 2023, N = 1,791), 50.9% of respondents prioritized health and beauty products with natural or organic ingredients. Four out of five shoppers favored certified organic, environmentally safe personal care products.
- Multi-source pre-purchase verification. Coc Coc's survey found shoppers verify product details via brand websites (28.5%), social networks (26.2%), and search engines (26.1%). Buyers also consult domain experts (23.1%), peer reviews (21.7%), family and friends (15.6%), and store staff (13.2%).
- Willingness to spend more for personalization. A 2023 Meta, DSG, and Bain study surveyed consumers across six Southeast Asian markets including Vietnam. Personalized experiences prompt 70% of consumers to spend more, 69% to repurchase, and 74% to recommend the brand.
- Creator endorsements outperforming brand discounts. Accenture's quantitative consumer study shows social proof now outweighs one-way promotional ads.
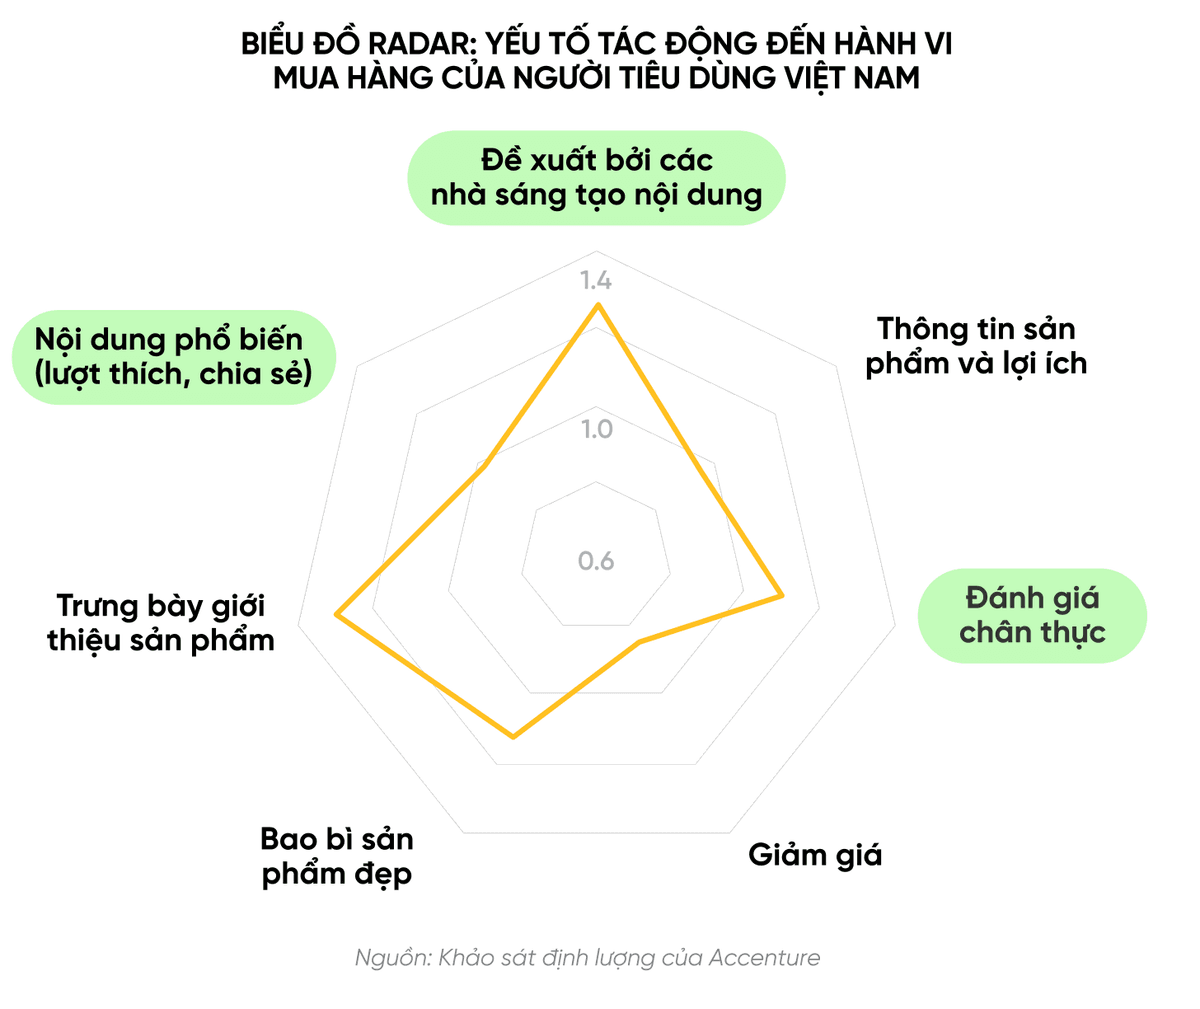
Accenture's radar chart places three social-proof factors in the high-influence zone with index scores above 1.0. Those top drivers are creator recommendations, authentic buyer reviews, and popular social posts. By contrast, standalone price discounts and brand benefit claims fall into the lower-impact tier.
Which five structural trends define the Vietnam retail market in 2025?
In Chapter 2, AppotaPay outlines five structural shifts guiding market-share expansion for retailers entering 2025.
Livestream shoppertainment and expansion into secondary regions
First, e-commerce advances toward USD 35 billion around livestream shoppertainment. Ministry of Industry and Trade projections place Vietnam's e-commerce revenue on track for USD 35 billion in 2025. According to Metric, shoppers spent VND 143.9 trillion across five major marketplaces in H1 2024. Over 50,000 active sellers hosted an average of 2.5 million livestream sessions per month, driving sharp platform divergence:
| E-Commerce Marketplace | H1 2024 Sales Growth vs. H1 2023 (YoY) | H1 2024 Sales Growth vs. H2 2023 (HoH) |
|---|---|---|
| TikTok Shop | +150.54% | +24.49% |
| Shopee | +65.97% | -2.29% |
| Lazada | -43.81% | -42.25% |
| Tiki | -48.55% | -31.56% |
| Sendo | -70.56% | -49.54% |
Second, physical retail expansion shifts toward secondary cities and rural districts. Statista projects Vietnam's retail market to grow 7.46% annually from 2024 to 2028. Prime street-front leases in Hanoi and Ho Chi Minh City face growing saturation. Rural areas home to over 60% of the population (60–65 million residents) and secondary hubs like Hai Phong, Can Tho, and Da Nang offer fresh catchment areas.
AI personalization, green policy standards, and omnichannel infrastructure
Third, AI- and Big Data-driven personalization powers customer retention. Chains in fast-moving consumer goods, mother-and-baby care, healthcare, and electronics are unifying customer profiles. Point-of-sale receipts, app searches, and 1:1 chat logs trigger replenishment offers timed to individual usage cycles.
Fourth, green retailing aligns buyer preferences with national policy targets. Nielsen data cited in the report shows 80% of consumers are willing to pay more for clean and green products. This demand aligns with the National Green Growth Strategy for 2021–2030, Vision to 2050 (Prime Ministerial Decision 1658/QD-TTg, effective October 1, 2021). By 2030, the strategy targets a digital economy share of 30% of GDP (50% by 2050) and at least 35% green public procurement. Greenhouse-gas emission intensity per unit of GDP must also drop at least 15% versus 2014.
Fifth, omnichannel fulfillment becomes baseline retail infrastructure. We Are Social's January 2024 report recorded 78.44 million Internet users in Vietnam (79.1% of the population, up 7.3%). Among users aged 16–64, 96.8% used messaging apps, 96.6% used social networks, 85.4% used search engines, and 75.8% visited shopping platforms. Accenture also found that 73% of Vietnamese shoppers expect seamless cross-channel journeys. Retailers must synchronize real-time store inventory, mobile ordering, and in-store pickup or returns.
How are Vietnamese consumer shopping and payment habits evolving in 2025?
Chapter 3 details four concrete shifts in how Vietnamese consumers evaluate products and pay every day:
- In-store trial paired with online deal capture (O2O). Shoppers inspect material quality and sizing at physical stores first. Younger buyers then verify unboxing videos on TikTok, YouTube, and Instagram before ordering during marketplace livestream events for vouchers and free shipping.
- Higher online frequency across pantry-stocking and immediate needs. According to NielsenIQ, online shopping frequency doubled in 2024 to at least four orders per month. Roughly 25% of online shoppers stock household essentials, while 21% order immediate food and beverages.
- Contactless payments embedded across daily routines. Backed by 9.31 billion cashless transactions worth VND 160 quadrillion in 7M 2024, digital payments span transit, dining, utilities, tuition, and retail checkouts. QR codes, e-wallets (MoMo, ZaloPay, VNPay, AppotaPay), Buy Now Pay Later (BNPL), and contactless SmartPOS terminals are now routine choices.
- Practical product value and behavior-based loyalty. Gen Z and Millennial buyers favor organic formulations, low-waste packaging (paper bags, reusable totes, recycled materials), and multi-purpose value packs. In loyalty programs, shoppers expect tiered benefits tied to purchase history rather than generic points.
What operational lessons emerge from WinMart, Mixue, and Thuong Dinh?
Chapter 4 benchmarks three distinct retail models across grocery, franchised beverages, and domestic footwear to show how store economics, pricing, and social buzz interact:
| Case Study Brand | Category & Price Positioning | Scale or Performance Cited in Report | Core Operational Levers |
|---|---|---|---|
| WinMart / WinMart+ (WinCommerce) | Multi-format supermarkets and minimarts | 3,675 stores as of September 2024. Revenue of VND 30,872B (2021), VND 29,372B (2022), and VND 30,054B (2023) per WinCommerce filings | Store portfolio restructuring. Co-locating staples, Techcombank services, and Phuc Long kiosks. Online fulfillment via WinMart.vn and Grab |
| Mixue | Franchised ice cream & tea (VND 20,000–40,000) | Over 36,000 global stores by 2023 and 1,000 outlets in Vietnam. Ahead of Highlands Coffee (605), Kem Trang Tien (200), The Coffee House (155), Phuc Long (114), Trung Nguyen (77) | Asset-light franchising. Affordable school-adjacent and neighborhood leases in secondary towns. Delivery density on GrabFood and ShopeeFood |
| Thuong Dinh Footwear | Heritage canvas shoes (VND 80,000–100,000) | 12,517 social discussions (68% share of voice vs. Asia Sports) and 495,496 interactions in Feb–Mar 2023 per SocialHeat | Gen Z retro fashion nostalgia. Low-friction impulse pricing. Organic styling buzz sparked by artist HIEUTHUHAI and TikTok creators |
Shared execution principles across pricing, density, and fulfillment
All three brands gained momentum without relying on heavy mass-media budgets. Each aligned accessible pricing with high-density presence where target buyers already gather, backed by rapid fulfillment.
Thuong Dinh's viral surge also highlights an operational caveat. Social buzz can multiply search demand overnight, but retaining buyers requires official marketplace storefronts, synced inventory, and smooth digital checkout.
Which four priorities should retailers execute to protect margins and cash flow?
Translating Chapter 5 into an action plan, retail CEOs, operations leads, and finance directors should prioritize four upgrades.
Omnichannel checkout integration and creator-led livestream schedules
- Unify in-store POS and online checkout. Connect store inventory with brand websites and Shopee, TikTok Shop, and Lazada storefronts. Equip counters with SmartPOS terminals, dynamic QR codes, and payment gateways supporting cards, e-wallets, and BNPL. Engineering and finance teams should review our payment gateway integration checklist for websites and mobile apps to enforce server-to-server Instant Payment Notification (IPN) verification.
- Pair scheduled livestream selling with authentic creator reviews. Avoid margin-eroding flash discounts by running recurring livestream calendars with domain voices and peer reviewers. Marketing teams can allocate talent roles and budgets using our framework for choosing and combining KOLs and KOCs.
Replenishment-cycle loyalty and automated daily payment reconciliation
- Shift loyalty programs to replenishment-cycle personalization. Use consented member purchase histories across mobile apps and store checkouts to time offers to product depletion cycles. Pair targeted rewards with transparent sourcing and eco-friendly packaging options.
- Automate real-time multi-store revenue tracking and daily reconciliation. Collecting funds across dozens of SmartPOS terminals, VietQR transfers, e-wallets, and marketplace accounts makes manual weekly spreadsheet matching prone to missed refunds or fee discrepancies. Finance teams should centralize dashboards and run a three-layer daily payment reconciliation workflow, alongside guides in our fintech and digital payments hub.
This web edition synthesizes the verified market benchmarks and strategic priorities from AppotaPay's research. Submit the download form on this page to receive the full 41-page PDF compiled by AppotaPay, including complete order-value distributions, online purchase frequency charts, and daily cashless journey maps.
Sources
- Báo cáo Nghiên cứu và dự báo xu hướng thị trường bán lẻ Việt Nam 2025, Công ty Cổ phần AppotaPay, 2024-10-01, accessed 2026-10-30
- Báo cáo tình hình kinh tế – xã hội tháng 8 và 8 tháng năm 2024, Cục Thống kê — Bộ Tài chính, 2024-09-06, accessed 2026-10-30
- Thống kê thanh toán không dùng tiền mặt 7 tháng năm 2024, Ngân hàng Nhà nước Việt Nam, 2024-09-10, accessed 2026-10-30
- Báo cáo Chỉ số Thương mại điện tử Việt Nam EBI 2024, Hiệp hội Thương mại điện tử Việt Nam (VECOM), 2024-04-18, accessed 2026-10-30
- Báo cáo sàn bán lẻ trực tuyến 6 tháng đầu năm 2024, Metric, 2024-07-25, accessed 2026-10-30
- Khảo sát doanh nghiệp ngành Bán lẻ Việt Nam năm 2024, Vietnam Report, 2024-09-26, accessed 2026-10-30
- Khảo sát 15.000 nhà bán lẻ và F&B tại Việt Nam, Sapo, 2024-01-15, accessed 2026-10-30
- Quyết định 1658/QĐ-TTg về Chiến lược quốc gia tăng trưởng xanh 2021–2030, Thủ tướng Chính phủ, 2021-10-01, accessed 2026-10-30
- Báo cáo Khảo sát Tiêu dùng Việt Nam (tháng 11/2023, N = 1.791), Cốc Cốc Research, 2023-12-15, accessed 2026-10-30
- Digital 2024: Vietnam, We Are Social & Meltwater, 2024-02-23, accessed 2026-10-30