
ReportsCorporate & Digital Economy
Vietnam Mobile Application Report 2021
Appota's 2021 report examines the Vietnam mobile app market against 2.91% GDP growth in 2020 and 60.88 Mbps average mobile download speeds. Daily smartphone engagement climbed to 5.1 hours across 22.1 weekly apps, lifting mobile game storefront revenue to USD 168 million, mobile advertising spend to USD 211.6 million, and digital payments volume to USD 11,607 million.
An executive analysis of Vietnam's 60.88 Mbps mobile broadband, smartphone behavior, mobile gaming, in-app ad eCPMs, e-wallets, and B2C e-commerce in 2020–2021 from Appota.
Key findings
- 60.88 Mbps (+40.7%)Vietnam's average mobile Internet download speed, ranking 2nd in Southeast Asia behind Thailand (66.82 Mbps), paired with an USD 11.27 monthly broadband cost among the 12 lowest worldwide (Speedtest Global Index).
- 5.1 hrs/day & 22.1 appsAverage daily smartphone usage (up from 4.0 hours) and weekly mobile applications opened by Vietnamese users in 2020 (up 31% from 16.8 apps) following pandemic social-distancing waves (Q&Me).
- 16M TikTok downloadsTotal mobile downloads of TikTok in Vietnam during 2020 (reaching 30% mobile device penetration), accompanied by a 175% surge in ad-attributed conversion installs via TikTok Ads (App Annie, AppsFlyer).
- USD 168M (+40% YoY)Vietnam mobile game paid-download and in-app purchase (IAP) revenue on Google Play and the App Store in 2020 across 1.50 billion downloads, projected to reach USD 205 million in 2021 (Statista, Appota).
- USD 211.6M (67.8%)Total mobile advertising expenditure in Vietnam in 2020 (projected at USD 227.4 million in 2021), representing 67.8% of total national digital advertising budgets (Statista, Adsota).
- USD 11,607MTotal digital payments transaction value in Vietnam in 2020 (forecast to jump nearly 30% to USD 15,071 million in 2021), as a 69% unbanked population share accelerated mobile wallet adoption (Statista, Global Findex).
- USD 11.8B B2C e-commerceVietnam's B2C e-commerce revenue in 2020 (up 18% YoY per the Ministry of Industry and Trade), with mobile commerce accounting for USD 5.6 billion and 62% of transaction volume (J.P. Morgan).
Which macroeconomic and telecom fundamentals powered the Vietnam mobile app market?
The Vietnam mobile app market expanded in 2020–2021 on the back of resilient macroeconomic growth during COVID-19. According to Vietnam's National Statistics Office under the Ministry of Finance (then the General Statistics Office), GDP grew 2.91% in 2020 after 7.02% in 2019. Vietnam avoided contractions seen in Indonesia (-2.07%), Japan (-4.80%), Singapore (-5.40%), Malaysia (-5.60%), Thailand (-6.10%), and the Philippines (-9.50%).
By December 2020, Vietnam's population reached 97,338,582, while urbanization climbed from 27% in 2005 to 38% (Worldometers). Consumer confidence briefly hit a 20-year low of 22 points in May 2020 (down from 91 in 2019 per InFocus Mekong Research). Demand rebounded alongside a 1.52% monthly CPI increase in February 2021 and 2021 GDP forecasts of 6.3% (ADB), 6.8% (World Bank), and 8.6% (Fitch Ratings).
60.88 Mbps mobile broadband and late-2020 smartphone market shifts
According to We Are Social's Digital 2021: Vietnam, mobile phone and Internet penetration both reached 70% of the population, with 64% of connections on 3G/4G. Fully 95% of Internet users go online via mobile devices, averaging 6.5 hours online daily (3 hours 18 minutes on mobile).
Ookla's Speedtest Global Index clocked Vietnam's average mobile download speed at 60.88 Mbps (+40.7% YoY), ranking second in Southeast Asia behind Thailand (66.82 Mbps). Monthly broadband costs averaged USD 11.27 (roughly VND 260,000), among the 12 lowest rates worldwide.
Affordable connectivity and year-end upgrades shifted hardware share toward iOS in Q4 2020 across Canalys (official shipments) and StatCounter (active devices):
| Vietnam Smartphone Indicator | Q3 2020 | Q4 2020 | Key Quarter-on-Quarter Shift |
|---|---|---|---|
| Active OS: Android (StatCounter) | 68.21% | 64.57% | Fell 3.64 percentage points during Q4 upgrades |
| Active OS: iOS (StatCounter) | 31.26% | 34.53% | Gained 3.27 percentage points on iPhone demand |
| Shipments: Samsung (Canalys) | 33% | 24% | Led total shipments despite a 19% YoY Q4 drop |
| Shipments: OPPO (Canalys) | 15% | 16% | Held 2nd place in unit shipments (-28% YoY in Q4) |
| Shipments: Xiaomi (Canalys) | 12% | Outside top 4 | Surged +114% QoQ in Q3 versus Q2 2020 |
| Shipments: Apple (Canalys) | Outside top 5 | 11%* | Jumped +197% YoY on authorized iPhone 12 sales |
| Shipments: Vsmart & Vivo (Canalys) | Vivo 9% / Vsmart 9% | Vsmart 11% | Vsmart tied for 3rd–4th place in Q4 shipments |
*Data hygiene note: Slide 17 prose mistakenly typed "Q2 2020" below the Q4 2020 table for Apple's +197% YoY surge.
Across active smartphones in Q4 2020 (StatCounter), Samsung (34.53%) and Apple (31.38%) held nearly two-thirds of the installed base, followed by OPPO (12.36%), Xiaomi (7.91%), Huawei (2.89%), and Vivo (2.51%).
How did Vietnamese smartphone behavior pivot toward short video and food delivery?
Lockdowns in 2020 permanently raised mobile engagement. According to Q&Me, daily smartphone usage rose from 4.0 to 5.1 hours (labeled +25% on the slide). Weekly active apps per user climbed 31%, from 16.8 to 22.1 apps.
Users aged 25–34 formed the largest Internet cohort at 28%, ahead of ages 15–24 (23%), 35–44 (20%), 6–14 (17%), 45–54 (8%), and 55+ (4%) per Statista. Active social media users reached 72 million (73% of the population), averaging 2 hours 21 minutes daily (We Are Social, 2021).
Among Internet users aged 16–64, YouTube (92.0%) and Facebook (91.7%) led reach. Domestic messenger Zalo reached 76.5%, outperforming Facebook Messenger (58.5%), Instagram (47.6%), and TikTok (38.5%).
Android versus iOS download mix and daily screen-time allocation
According to Applyzer (slide 21), Games accounted for 64.5% of Android downloads compared with 41.2% on iOS. iPhone users distributed downloads more evenly across Entertainment (8.1%), Photo & Video (6.7%), Business (5.8%), Utilities (5.3%), Education (4.9%), and Finance (4.9%).
By screen-time share (slide 22), Social Networking captured 28% of mobile hours, ahead of Video/Movies (16%), Messaging/Calls (15%), Gaming (12%), Shopping (3%), and Weather (3%). Individually, Facebook took 25% of mobile time, followed by YouTube (12%), Zalo (7%), Messenger (6%), and TikTok (4%, passing Instagram).
TikTok's 16 million downloads and the food-delivery app boom
Per App Annie (slide 23), TikTok reached 30% mobile device penetration in Vietnam (up from 12 million users in 2019). The app recorded 16 million mobile downloads in 2020, including 160% growth on iOS.
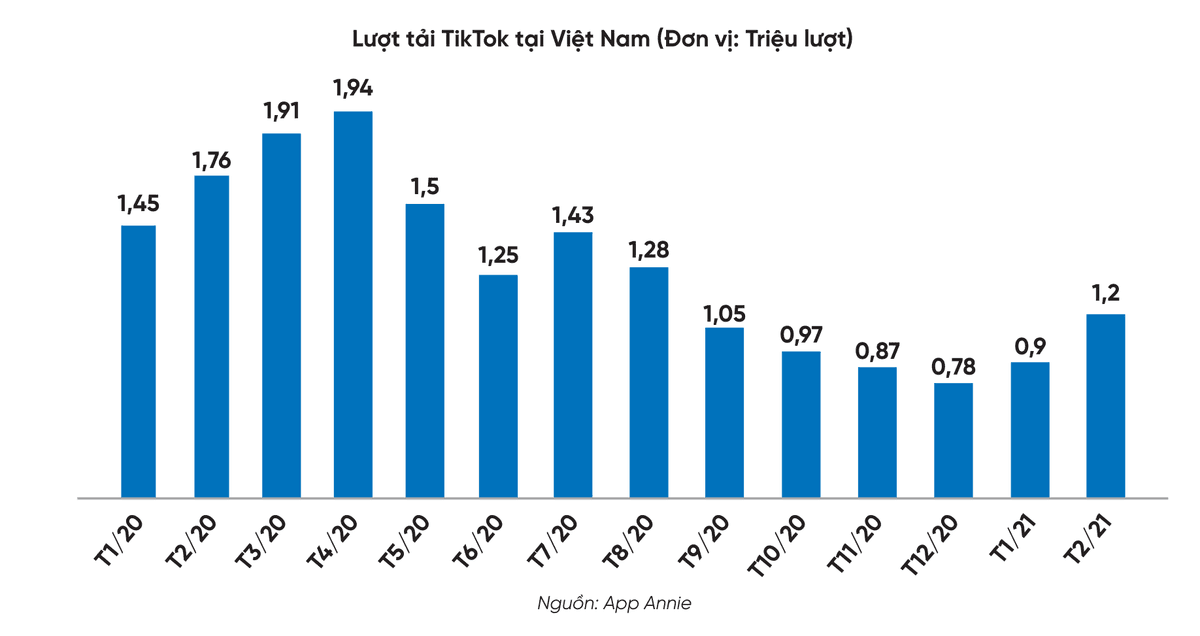
Vietnam's first COVID-19 wave drove 5.6 million TikTok installs, peaking in March 2020 (1.91 million) and April 2020 (1.94 million). After dipping to 0.78 million in December 2020, installs rebounded to 0.9 million in January 2021 and 1.2 million in February 2021.
Food-delivery apps (GrabFood, Now.vn, GoFood, Baemin, Loship) saw weekly users quadruple from 20% in 2016 to 80% in 2020 (Q&Me). Third-party app ordering climbed from 58% (2018) to 82% (2020), while direct restaurant phone orders fell from 71% to 23%.
How did mobile gaming and eSports perform as storefront revenue jumped 40%?
According to We Are Social (2021), 85% of Vietnamese Internet users aged 16–64 play games on smartphones, ahead of PC/Laptop (44%), tablets (22.60%), and consoles (8.60%). Appota and Statista figures show sustained growth from 2017 to 2021:
| Vietnam Mobile Gaming Metric | 2017 | 2018 | 2019 | 2020 | 2021 (Forecast) |
|---|---|---|---|---|---|
| New hardcore releases (Appota) | — | 123 | 171 | 212 | 200 |
| Total game downloads (Appota) | 1.35B | 1.39B | 1.38B | 1.50B | 1.55B |
| Storefront IAP & paid revenue (Statista) | USD 72M | USD 93M | USD 120M | USD 168M | USD 205M |
| Storefront revenue YoY growth | — | +29% | +29% | +40% | +22% |
| ARPU (Statista) | USD 15.26 | USD 18.85 | USD 22.98 | USD 27.14 | USD 30.92* |
*Note: Statista projected mobile game storefront ARPU to reach USD 34.10 in 2022.
Analysts often misread Statista's USD 168 million figure (+40% YoY) as total Vietnam gaming revenue. As slide 31 notes, it tracks only direct paid downloads and IAP on Google Play and the App Store, excluding off-store web portals and prepaid card top-ups.
In monetization mix (slide 33), 87% of Vietnamese mobile games run in-app ads (73% globally) and 40% use IAP (21% globally). Upfront paid games represent just 2% (5% globally).
Garena versus VNG in mobile eSports and the iOS–Android retention gap
In Appota's 2020 eSports survey (slide 34), 79.4% played more eSports and 80.2% watched more tournaments post-lockdown, averaging 2 hours 55 minutes playing and 2 hours 10 minutes watching daily. Smartphones led as the primary playing device (58.3%) and viewing screen (70.7%).
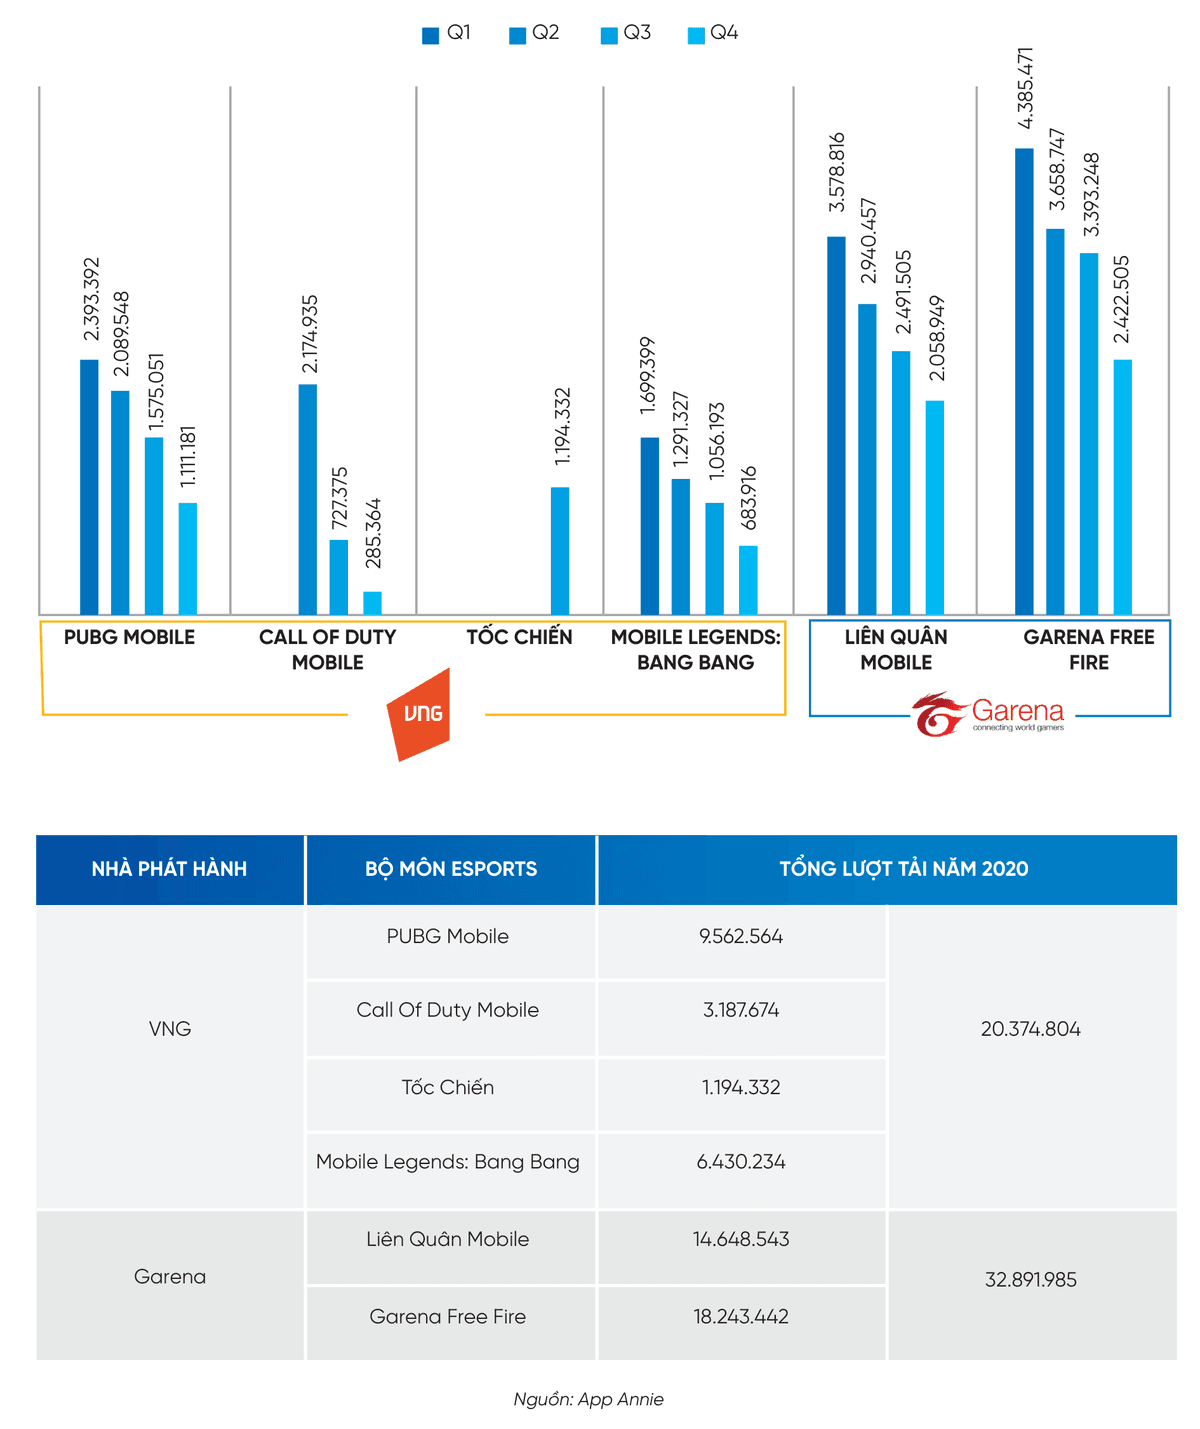
App Annie's full-year 2020 download totals (slide 35) detail the rivalry between Vietnam's two top eSports publishers:
| Publisher | Mobile eSports Title | 2020 Downloads (App Annie) | 2020 Operational Highlight |
|---|---|---|---|
| Garena | Garena Free Fire | 18,243,442 | Led overall installs via accessible device specs |
| Garena | Arena of Valor (Liên Quân) | 14,648,543 | Maintained 3.3M–3.8M quarterly installs on chart |
| Garena Subtotal | 2 flagship titles | 32,891,985 | 61.7% of installs across the 6 tracked titles |
| VNG | PUBG Mobile | 9,562,564 | Anchored VNG's tactical battle royale audience |
| VNG | Mobile Legends: Bang Bang | 6,430,234 | Competed head-to-head in 5v5 mobile MOBA |
| VNG | Call of Duty: Mobile VN | 3,187,674 | Launched in Q2 2020 with strong initial installs |
| VNG | League of Legends: Wild Rift | 1,194,332 | Released late Q4 2020, entering top store charts |
| VNG Subtotal | 4 flagship titles | 20,374,804 | Spanned battle royale, FPS, and MOBA genres |
AppsFlyer and Sensor Tower data (slides 36–38) show iOS Gaming Day 1 retention exceeded 30% versus roughly 24% on Android. H2 2020 iOS top downloads clustered around licensed eSports titles, while Google Play top downloads churned across hyper-casual hits from Voodoo, SayGames, Lion Studios, and Among Us!.
Where did USD 211.6 million in mobile ad spend deliver top eCPM and conversion?
Per Statista and Adsota (slide 41), Vietnam's mobile ad spend rose from USD 136.1 million (2018) and USD 190.6 million (2019) to USD 211.6 million in 2020 (+11.0% YoY), projected at USD 227.4 million in 2021.
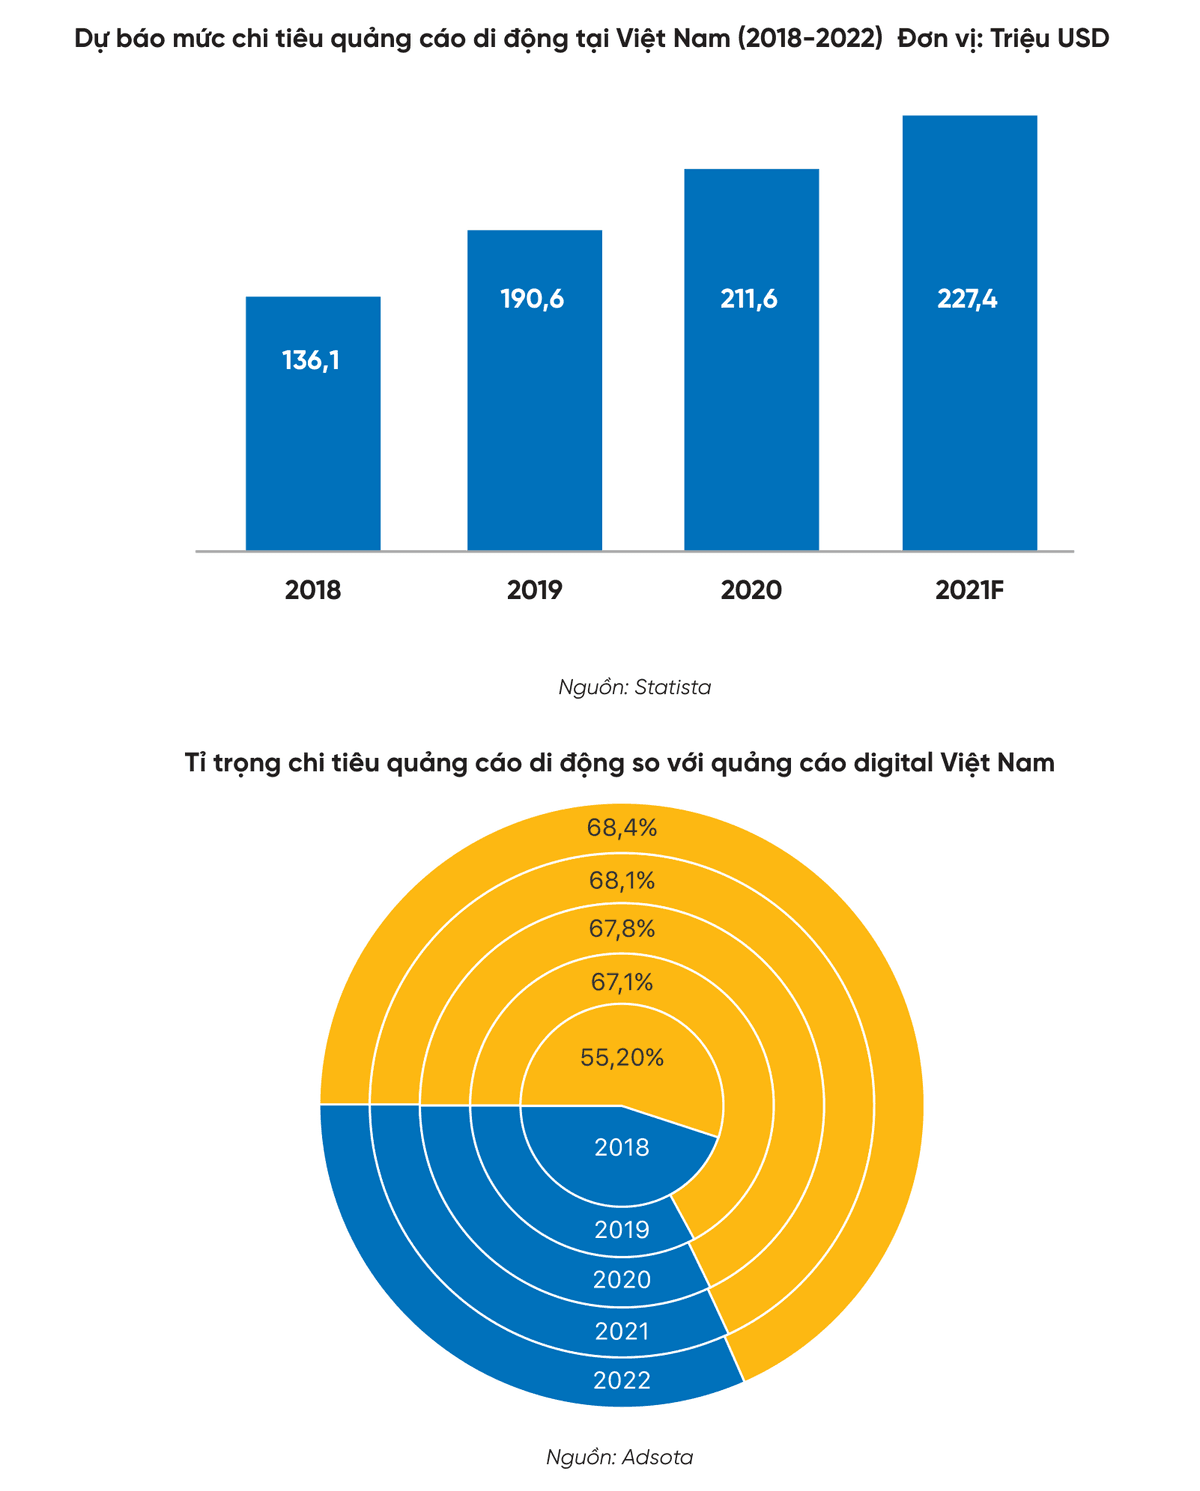
Mobile's share of total digital ad budgets climbed from 55.20% (2018) to 67.8% (2020) and 68.4% by 2022F (Adsota). Per 42matters (December 2020), apps in Vietnam averaged 289,010 downloads (171% of the 169,040 global mean); 59% integrated ads (38% globally), 18% used IAP (4% globally), and 9% were paid apps (3% globally).
Q3–Q4 2020 eCPM spreads across operating systems and screen sizes
Appodeal benchmarks (slide 44) highlight sharp H2 2020 eCPM differences between iOS and Android:
| Operating System | In-App Format | Q3 2020 eCPM (USD) | Q4 2020 eCPM (USD) | QoQ Change |
|---|---|---|---|---|
| iOS | Rewarded Video | 2.60 | 3.15 | +21.2% |
| iOS | Fullscreen | 0.98 | 1.10 | +12.2% |
| iOS | Banner | 0.11 | 0.10 | -9.1% |
| Android | Rewarded Video | 1.08 | 1.14 | +5.6% |
| Android | Fullscreen | 0.60 | 1.01 | +68.3% |
| Android | Banner | 0.11 | 0.11 | 0.0% |
Q4 iOS Rewarded Video eCPM reached USD 3.15 (2.76x Android), while Android Fullscreen jumped 68.3% to USD 1.01. Per StatCounter (January 2021, slide 49), top mobile resolutions were 360×640 (13.54%, printed 360x460) and 360×780 (9.25%), ahead of 414×736 (7.43%) and 412×892 (5.64%).
Agency versus brand channel mix alongside TikTok Ads and OTT conversion
Q&Me's 2020 survey (slide 45) revealed a sharp channel divide. Brands favored Facebook (77%), YouTube (63%), Google Ads (51%), Instagram (48%), TikTok (41%), and placed only 36% on e-commerce marketplaces. Agencies elevated e-commerce marketplaces to third place at 63% (behind Facebook 68% and YouTube 65%, ahead of Google Ads 50% and TikTok 48%), with 23% also buying ads on Grab/Gojek.
Two video channels justified agencies' rapid reallocation:
- TikTok Ads topped foreign ad networks in install conversion. Statista (2020) ranked TikTok third in social ad effectiveness at 13% behind Facebook (34%) and YouTube (29%). AppsFlyer ranked TikTok Ads first among foreign ad networks in Vietnam install conversion (ahead of AdColony, Accesstrade, Vungle, Vivo) with +175% conversion installs.
- OTT video ads captured ad-tolerant mobile streamers. Smartphones account for 67% of Southeast Asian OTT devices (slide 48). Fully 67% use ad-supported OTT, 86% accept ads for free content, and OTT ads posted a 35% purchase-conversion rate in Vietnam.
How did a 69% unbanked gap accelerate mobile wallets and B2C e-commerce?
Per Statista, Global Findex, and PPRO (slides 52–53), only 30.8% (~31%) of Vietnamese residents held a bank account, far below Singapore (98%), Malaysia (85%), and Thailand (82%). Debit cards reached 26.74% and credit cards 4.12%, despite a 69% savings rate.
Per Statista (slides 54–55), digital payments value rose from USD 6,899 million (2017) to USD 11,607 million in 2020 (+4.8% YoY), projected to jump 29.8% to USD 15,071 million in 2021. Annual spend per user stood at USD 280.3 in 2020 (USD 219.0 digital commerce or 78.2%; USD 61.3 mobile POS or 21.8%), forecast at USD 323.5 in 2021.
Wallet funnel competition across MoMo, ViettelPay, ZaloPay, and unicorn VNPay
Vietnam counted 121 fintech startups in 2020, led by Payments at 31% (P2P Lending 16%, Blockchain/Crypto 12%, POS 7.5%, Wealth Management 7.5%). e-Conomy SEA 2020 (Google, Temasek, Bain) confirmed VNPay exceeded a USD 1 billion valuation, while MoMo reached 20 million personal users in September 2020.
Q&Me tracked 2020 download growth of +61% for ViettelPay, +50% for MoMo, and +40% for ZaloPay. MoMo led the funnel with 94% awareness, 79% current usage, and 61% regular usage, ahead of ViettelPay (76% / 32% / 15%) and ZaloPay (72% / 25% / 6%). In February 2021, App Annie recorded ZaloPay (394,000 downloads) overtaking ViettelPay (366,000), behind MoMo (688,000).
USD 11.8 billion in B2C e-commerce and the 11.11 livestream race
Per the Ministry of Industry and Trade (slide 61), B2C e-commerce grew from USD 4.07 billion (2015) and USD 10.08 billion (2019) to USD 11.8 billion in 2020 (+18% YoY). Mobile commerce reached USD 5.6 billion in 2020 (62% of volume) and was projected by J.P. Morgan (slides 62, 76) to reach USD 7.0 billion in 2021 and USD 10.2 billion by 2023 (+18.6%/year).
Facebook and Bain counted 49 million digital consumers aged 15+ in 2020 (65% penetration). Contrary to Gen Z stereotypes, We Are Social (slide 64) found monthly online purchase incidence peaked among ages 35–44 (85.3%), 45–54 (83.5%), and 25–34 (81.8%), outpacing ages 16–24 (70.6%).
In 2020, online Travel fell 40.5%, while Food & Personal Care (+45.9%), Fashion & Beauty (+37.2%), and Video Games (+35.3%) surged (We Are Social). Between 2020 and 2023F (PPRO, J.P. Morgan), Cards drop from 34% to 29% and Cash from 21% to 15%, as Bank Transfers rise from 26% to 30% and E-wallets from 14% to 22%.
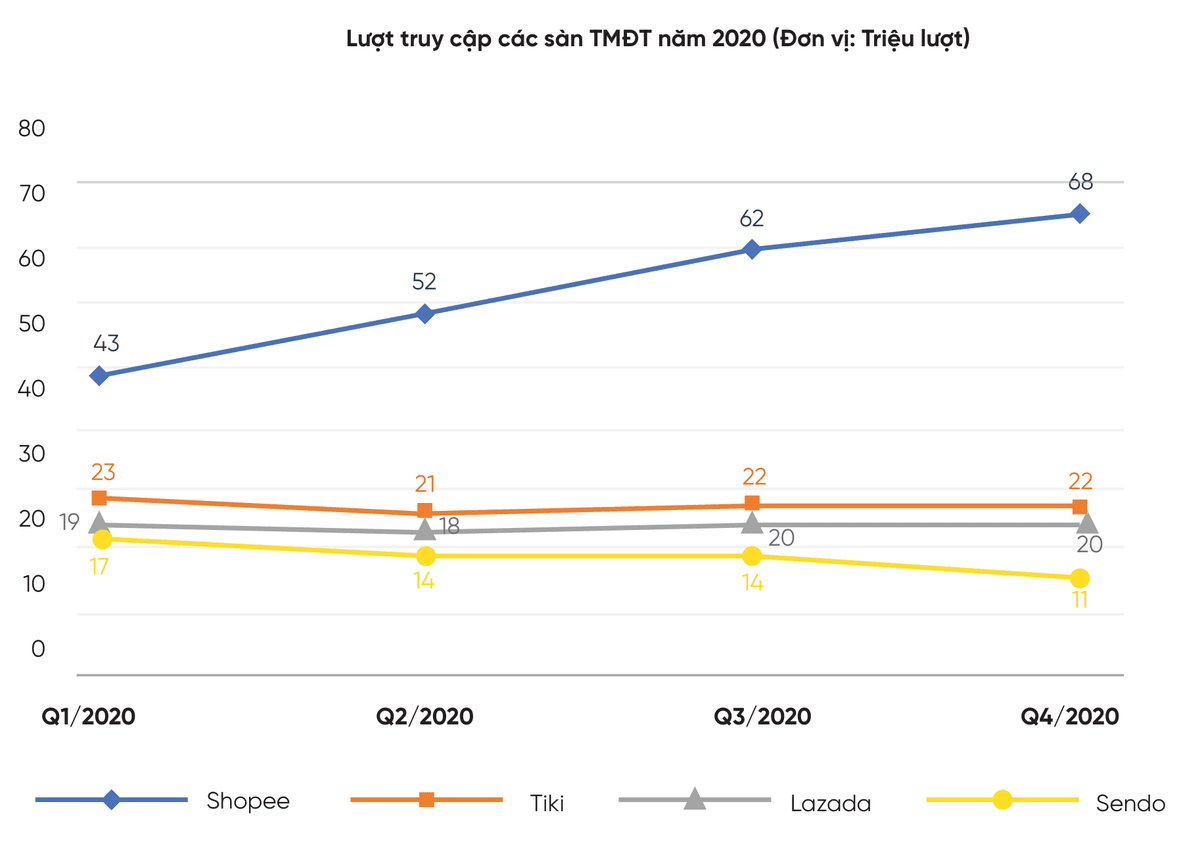
Vietnam's top four marketplaces diverged across web visits, Q4 app installs, and 11.11 campaigns (slides 67–71):
| Marketplace | Q1 → Q4 2020 Web Visits (M) | Q4 2020 App Momentum (App Annie) | 11.11 Mentions (Reputa) | 11.11 Social Reach (Reputa) |
|---|---|---|---|---|
| Shopee | 43 → 52 → 62 → 68 | Led installs Jan–Oct; expanded Shopee Live | 13,548 (72.67% zero-dong shipping/deals) | 37,447,588 |
| Lazada | 19 → 18 → 20 → 20.8* | +40% QoQ to 2.84M installs; led Nov 20–Feb 21 | 9,801 | 55,229,300 (Lee Min Ho, Chi Pu, LazLive 3D) |
| Tiki | 23 → 21 → 22 → 22 | Held steady 2nd place in domestic web traffic | 2,084 | 7,098,728 |
| Sendo | 17 → 14 → 14 → 11 | Lower Q4 web visits while retaining social reach | 864 | 18,508,521 |
*Note: Slide 67 rounds Lazada's Q4 chart bar to 20M visits; the slide prose specifies 20.8M visits.
Reputa's 11.11 audit contrasts two winning mobile tactics. Shopee drove 138% of Lazada's social mentions via zero-dong shipping vouchers, whereas Lazada achieved 147% of Shopee's social reach via celebrity ambassadors and an in-app 3D livestream concert.
How should executives adapt mobile product, ad, and payment strategies?
Synthesizing all five chapters highlights four operational priorities for product leaders, marketers, and publishers in Vietnam:
- Tailor hybrid monetization by operating system. With 87% of games running ads while iOS delivers >30% Day 1 retention and USD 3.15 Q4 Rewarded Video eCPMs (versus USD 1.14 on Android), studios should pair ad scale on Android with deeper IAP bundles on iOS. Publishers can align launch workflows with the six-step mobile game publishing roadmap in Vietnam and test retention via the three-gate mobile game soft-launch checklist.
- Reallocate UA budgets toward TikTok Ads, retail media, and creator video. Bridging the 63%-versus-36% agency-brand retail media gap and capturing TikTok Ads' +175% install conversion surge requires native short video and livestreaming. Teams can structure creator tiers using our KOL versus KOC budget allocation guide.
- Streamline in-app bank transfers, QR codes, and e-wallet checkout. With 69% unbanked residents and bank transfers (30% by 2023F) plus e-wallets (22%) overtaking cash, frictionless mobile checkout directly lifts conversion among core 25–54-year-old buyers. Engineers can verify callback security using the secure payment gateway integration checklist.
- Benchmark digital-economy shifts quarterly. Track subsequent market studies across our corporate and digital economy hub.
This executive edition consolidates every source-verified benchmark and unit reconciliation from the original study. Complete the form on this page to download the full 78-page PDF report from Appota, including monthly chart breakdowns and H2 2020 store rankings.
Sources
- Báo cáo ứng dụng di động 2021 (Vietnam Mobile Application Report 2021), Công ty Cổ phần Appota, 2021-05-01, accessed 2026-10-31
- Báo cáo tình hình kinh tế – xã hội năm 2020 và chỉ số giá tiêu dùng (CPI) đầu năm 2021, Cục Thống kê – Bộ Tài chính (thời điểm công bố: Tổng cục Thống kê), 2021-03-01, accessed 2026-10-31
- Digital 2021: Vietnam, We Are Social & Kepios, 2021-02-11, accessed 2026-10-31
- Speedtest Global Index — Mobile & Fixed Broadband Speeds and Broadband Pricing, Ookla (Speedtest Global Index), 2021-01-15, accessed 2026-10-31
- Vietnam Smartphone Market Share Q3 & Q4 2020, Canalys, 2021-02-10, accessed 2026-10-31
- Mobile Operating System, Vendor & Screen Resolution Market Share Viet Nam (2020 – Jan 2021), StatCounter GlobalStats, 2021-02-01, accessed 2026-10-31
- Vietnam Mobile App Usage, Food Delivery, Digital Marketing & E-Wallet Surveys 2020, Q&Me (Asia Plus Inc.), 2021-01-20, accessed 2026-10-31
- Vietnam Mobile App Downloads: TikTok, Mobile eSports, E-Wallets & E-Commerce (2020 – Feb 2021), App Annie (nay thuộc Sensor Tower), 2021-03-15, accessed 2026-10-31
- Digital Market Outlook: Mobile Games, Mobile Advertising & Digital Payments in Vietnam, Statista, 2021-02-01, accessed 2026-10-31
- App Retention Benchmarks & Performance Index 2020 (Southeast Asia & Vietnam), AppsFlyer, 2020-11-15, accessed 2026-10-31
- Vietnam App Monetization Benchmarks & Mobile In-App eCPM Report Q3–Q4 2020, 42matters & Appodeal, 2021-01-25, accessed 2026-10-31
- Sách trắng Thương mại điện tử Việt Nam năm 2021, Cục Thương mại điện tử và Kinh tế số – Bộ Công Thương, 2021-04-15, accessed 2026-10-31
- 2020 E-commerce Payments Trends Report: Vietnam, J.P. Morgan & PPRO, 2020-10-15, accessed 2026-10-31
- e-Conomy SEA 2020, Digital Consumers of Tomorrow 2020 & Đo lường chiến dịch 11.11 tại Việt Nam, Google, Temasek & Bain & Company; Facebook & Bain & Company; Reputa, 2020-11-25, accessed 2026-10-31